Technical Analysis: Gold prices hover near key support levels
2026-04-27 18:26:44
International gold prices have recently entered a narrow trading range, hovering around $4,640 per ounce for the past few trading days. This price level currently coincides precisely with the 100-day exponential moving average (EMA), forming a key short-term support area. The market is currently facing two key variables: firstly, the standoff between the US and Iran over the Strait of Hormuz remains deadlocked, with peace negotiations failing to resume, and geopolitical uncertainty providing some safe-haven buying support for gold prices; secondly, this week, the world's four major central banks—the Federal Reserve, the European Central Bank, the Bank of England, and the Bank of Japan—will successively announce their interest rate decisions. Against the backdrop of policy uncertainty, gold traders are generally maintaining a cautious wait-and-see attitude, unwilling to rashly bet on a single direction, resulting in low market activity.

From a technical perspective, the overall trend of this precious metal remains under pressure: the price continues to trade below the previous upward trend line extending from the low of November 5th last year, and has encountered strong resistance near $4840/ounce, failing to break through effectively on multiple attempts. This technical pattern makes the overall outlook for gold cautiously pessimistic. However, for the bears to further expand their gains and attract more follow-up selling, they still need to push the price to decisively break below the key support level of $4640—that is, for the closing price to remain firmly below this level—to confirm the continuation of the downtrend.
Looking ahead, two key factors could trigger a break in gold prices: First, if the Federal Reserve maintains a hawkish stance, hinting at a delay in interest rate cuts or further tightening of monetary policy, it could lead to a stronger dollar and higher US Treasury yields, thus suppressing the attractiveness of gold as a non-interest-bearing asset. Second, if geopolitical conflicts in the Middle East show signs of escalation or the peace process encounters more substantial obstacles, it could trigger increased risk aversion in the market. However, historical experience shows that if the conflict does not spread further to core energy supply regions, its boosting effect on gold prices may gradually diminish, and a correction in gold prices could occur due to a recovery in risk appetite. Once the $4,640 support level is breached, bears are expected to target the $4,345/ounce area. This price level is not only an important psychological barrier but also intersects with the 200-day exponential moving average (EMA), forming a strong support level. If this support level also fails, gold prices could further decline to test the low of $4,100/ounce reached on March 23.
In terms of technical indicators, the Relative Strength Index (RSI) is currently consolidating sideways near the 50 level, indicating that the market is temporarily in a state of equilibrium between bulls and bears, lacking clear directional momentum; while the Moving Average Convergence Divergence (MACD) is running slightly below the zero axis and is very close to the signal line, further confirming the market characteristics of short-term gold price consolidation and unclear trend.
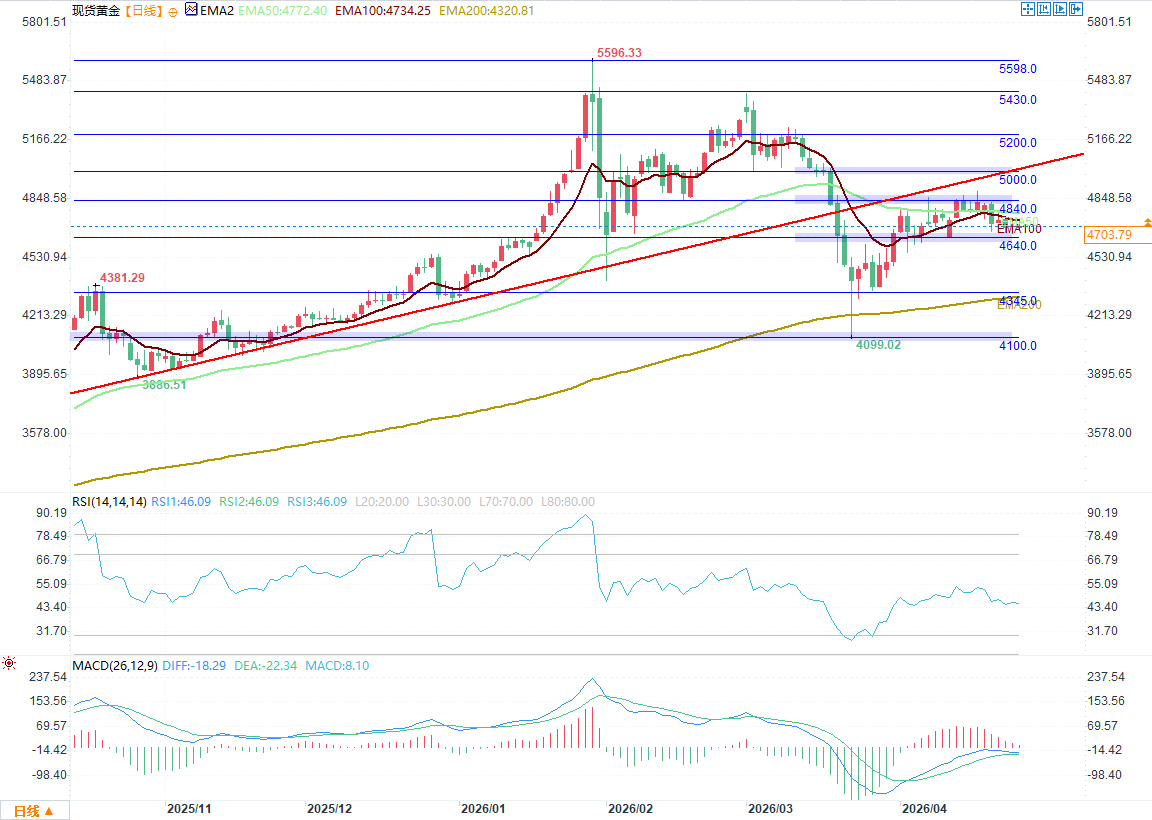
To reverse the current weak trend, gold needs a breakthrough rally: only a strong rebound and a firm hold above the $5,000/ounce level can effectively break free from previous downward pressure, reclaim the aforementioned upward trend line, and open up further upside potential. At that point, bulls are expected to challenge the resistance levels of $5,200/ounce and $5,450/ounce; if both resistance areas are breached, market attention may focus on the historical high of $5,598/ounce.
In summary, international gold prices are currently at a critical juncture, with a tug-of-war between bulls and bears around the 100-day exponential moving average and the support level of $4,640. Although prices remain below the previous upward trend line and the overall trend is under pressure, bears need to decisively break below $4,640 to further dominate the market. This week's numerous central bank decisions may be the key catalyst to break the current consolidation pattern.
From a technical perspective, the overall trend of this precious metal remains under pressure: the price continues to trade below the previous upward trend line extending from the low of November 5th last year, and has encountered strong resistance near $4840/ounce, failing to break through effectively on multiple attempts. This technical pattern makes the overall outlook for gold cautiously pessimistic. However, for the bears to further expand their gains and attract more follow-up selling, they still need to push the price to decisively break below the key support level of $4640—that is, for the closing price to remain firmly below this level—to confirm the continuation of the downtrend.
Looking ahead, two key factors could trigger a break in gold prices: First, if the Federal Reserve maintains a hawkish stance, hinting at a delay in interest rate cuts or further tightening of monetary policy, it could lead to a stronger dollar and higher US Treasury yields, thus suppressing the attractiveness of gold as a non-interest-bearing asset. Second, if geopolitical conflicts in the Middle East show signs of escalation or the peace process encounters more substantial obstacles, it could trigger increased risk aversion in the market. However, historical experience shows that if the conflict does not spread further to core energy supply regions, its boosting effect on gold prices may gradually diminish, and a correction in gold prices could occur due to a recovery in risk appetite. Once the $4,640 support level is breached, bears are expected to target the $4,345/ounce area. This price level is not only an important psychological barrier but also intersects with the 200-day exponential moving average (EMA), forming a strong support level. If this support level also fails, gold prices could further decline to test the low of $4,100/ounce reached on March 23.
In terms of technical indicators, the Relative Strength Index (RSI) is currently consolidating sideways near the 50 level, indicating that the market is temporarily in a state of equilibrium between bulls and bears, lacking clear directional momentum; while the Moving Average Convergence Divergence (MACD) is running slightly below the zero axis and is very close to the signal line, further confirming the market characteristics of short-term gold price consolidation and unclear trend.
To reverse the current weak trend, gold needs a breakthrough rally: only a strong rebound and a firm hold above the $5,000/ounce level can effectively break free from previous downward pressure, reclaim the aforementioned upward trend line, and open up further upside potential. At that point, bulls are expected to challenge the resistance levels of $5,200/ounce and $5,450/ounce; if both resistance areas are breached, market attention may focus on the historical high of $5,598/ounce.
In summary, international gold prices are currently at a critical juncture, with a tug-of-war between bulls and bears around the 100-day exponential moving average and the support level of $4,640. Although prices remain below the previous upward trend line and the overall trend is under pressure, bears need to decisively break below $4,640 to further dominate the market. This week's numerous central bank decisions may be the key catalyst to break the current consolidation pattern.
- Risk Warning and Disclaimer
- The market involves risk, and trading may not be suitable for all investors. This article is for reference only and does not constitute personal investment advice, nor does it take into account certain users’ specific investment objectives, financial situation, or other needs. Any investment decisions made based on this information are at your own risk.