EUR/USD Technical Analysis: Upward momentum is accelerating, with a golden cross forming between the 20-day and 200-day moving averages.
2026-04-27 19:50:27
On Monday (April 27), the euro strengthened further against the dollar, suggesting initial signs that a reversal pattern may be forming on the daily chart.
The rebound that started from the relatively high support level around 1.1670 has continued into its second day. The price has successfully broken through the important resistance level of 1.1745 (which is also the top of the daily Ichimoku cloud). If this breakout point can be held, it will help further strengthen the uptrend and pave the way for further gains.
Recently, when prices retreated from the high of 1.1848 (the peak reached on April 17), they encountered strong support at the 1.1681/75 level. This support level corresponds to the 38.2% Fibonacci retracement level of the 1.1410/1.1848 uptrend (1.1736), and also coincides with the 200-day moving average (1.1675). A double bottom pattern formed near 1.1681/75, and a bullish candlestick pattern emerged (as shown in Friday's chart).
The 20-day moving average (1.1684) broke above the 200-day moving average (1.1675), forming a golden cross, which further supported the upward momentum of prices. From the technical pattern of the daily chart, the overall trend is upward.
The price has successfully broken through the bottom of the cloud (Senkou A, 1.1592), and has also completed approximately a 50% Fibonacci retracement from the high (corresponding to 1.1758). The daily Tenkan-sen (conversion line) indicator is at 1.1758, and the Kijun-sen (baseline) is at 1.1645, suggesting that short-term target prices may be around 1.1779 (61.8% Fibonacci level) and 1.1806. The important resistance level of 1.1848 should be watched closely.
This view is supported by forecasts of monetary policy direction in the coming months. Economists expect the European Central Bank to begin tightening monetary policy as early as June, with interest rates projected to rise by 50 basis points by October. The Federal Reserve, on the other hand, is likely to maintain its current policy at its next meeting (which will be Powell's last policy decision during his term). Furthermore, the new governor of the US Federal Reserve is expected to be more willing to meet President Trump's demands for lower interest rates.
The 100-day moving average (1.1706) has been broken and now acts as strong support. This support level is expected to prevent further declines should the price fall during a pullback above the cloud top. However, as long as the price holds above the 200-day moving average (1.1675), the overall trend remains upward – as the 200-day moving average has been providing effective support since April.
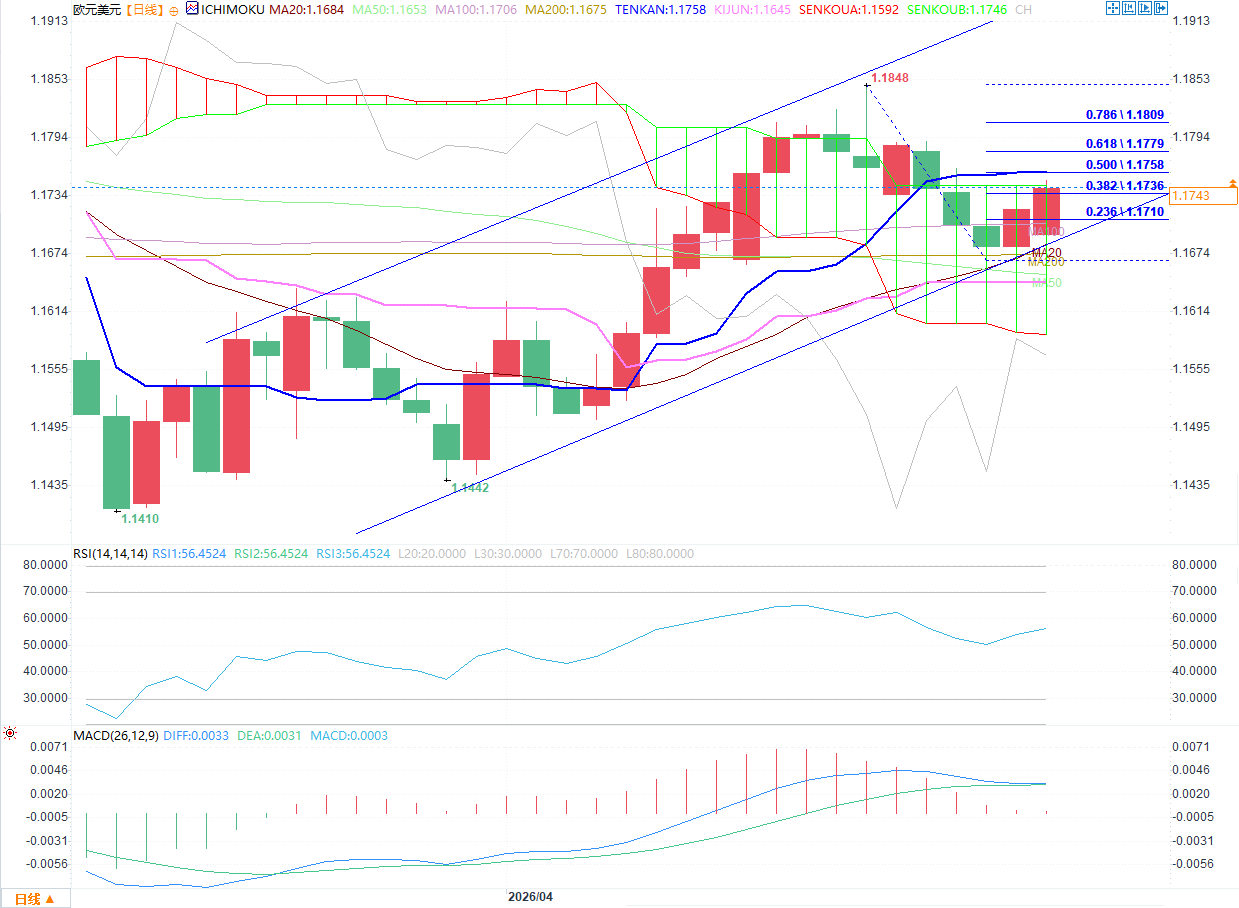
(EUR/USD daily chart source: FX678)
From the perspective of oscillation indicators, the RSI (14) is currently at 56.54, which is in the neutral to strong range and has not yet entered the overbought zone, so there is still room for upward movement. In the MACD indicator, the DIFF line (0.0033) is slightly higher than the DEA line (0.0031), and the histogram is positive (0.0003), showing a mild bullish momentum, but there has not yet been a significant increase in volume. We need to pay attention to whether the momentum can continue to expand.
Key price levels for reference:
Recent support levels: 1.1745 (Golden Peak), 1.1706 (100-day moving average), 1.1675 (200-day moving average)
Near-term resistance levels: 1.1758 (50% Fibonacci retracement), 1.1779 (61.8% Fibonacci retracement), 1.1806, 1.1848 (previous high).
The rebound that started from the relatively high support level around 1.1670 has continued into its second day. The price has successfully broken through the important resistance level of 1.1745 (which is also the top of the daily Ichimoku cloud). If this breakout point can be held, it will help further strengthen the uptrend and pave the way for further gains.
Recently, when prices retreated from the high of 1.1848 (the peak reached on April 17), they encountered strong support at the 1.1681/75 level. This support level corresponds to the 38.2% Fibonacci retracement level of the 1.1410/1.1848 uptrend (1.1736), and also coincides with the 200-day moving average (1.1675). A double bottom pattern formed near 1.1681/75, and a bullish candlestick pattern emerged (as shown in Friday's chart).
The 20-day moving average (1.1684) broke above the 200-day moving average (1.1675), forming a golden cross, which further supported the upward momentum of prices. From the technical pattern of the daily chart, the overall trend is upward.
The price has successfully broken through the bottom of the cloud (Senkou A, 1.1592), and has also completed approximately a 50% Fibonacci retracement from the high (corresponding to 1.1758). The daily Tenkan-sen (conversion line) indicator is at 1.1758, and the Kijun-sen (baseline) is at 1.1645, suggesting that short-term target prices may be around 1.1779 (61.8% Fibonacci level) and 1.1806. The important resistance level of 1.1848 should be watched closely.
This view is supported by forecasts of monetary policy direction in the coming months. Economists expect the European Central Bank to begin tightening monetary policy as early as June, with interest rates projected to rise by 50 basis points by October. The Federal Reserve, on the other hand, is likely to maintain its current policy at its next meeting (which will be Powell's last policy decision during his term). Furthermore, the new governor of the US Federal Reserve is expected to be more willing to meet President Trump's demands for lower interest rates.
The 100-day moving average (1.1706) has been broken and now acts as strong support. This support level is expected to prevent further declines should the price fall during a pullback above the cloud top. However, as long as the price holds above the 200-day moving average (1.1675), the overall trend remains upward – as the 200-day moving average has been providing effective support since April.
(EUR/USD daily chart source: FX678)
From the perspective of oscillation indicators, the RSI (14) is currently at 56.54, which is in the neutral to strong range and has not yet entered the overbought zone, so there is still room for upward movement. In the MACD indicator, the DIFF line (0.0033) is slightly higher than the DEA line (0.0031), and the histogram is positive (0.0003), showing a mild bullish momentum, but there has not yet been a significant increase in volume. We need to pay attention to whether the momentum can continue to expand.
Key price levels for reference:
Recent support levels: 1.1745 (Golden Peak), 1.1706 (100-day moving average), 1.1675 (200-day moving average)
Near-term resistance levels: 1.1758 (50% Fibonacci retracement), 1.1779 (61.8% Fibonacci retracement), 1.1806, 1.1848 (previous high).
- Risk Warning and Disclaimer
- The market involves risk, and trading may not be suitable for all investors. This article is for reference only and does not constitute personal investment advice, nor does it take into account certain users’ specific investment objectives, financial situation, or other needs. Any investment decisions made based on this information are at your own risk.