The US dollar and US Treasury bonds are working together to strangle gold; the FOMC's hawkish stance is imminent, and gold prices are hanging by a thread.
2026-04-29 20:30:54
On Wednesday (April 29), global financial markets were at a highly sensitive turning point. Constrained by ongoing international geopolitical tensions, commodity and foreign exchange markets exhibited a strong negative correlation. The recent strengthening of both US Treasury yields and the US dollar index directly put significant pressure on gold prices. Meanwhile, the oil market saw a sharp price increase due to a renewed rise in supply-side risk premiums, further exacerbating market concerns about runaway inflation.
With the Federal Reserve's April FOMC meeting entering its final decision-making phase, market sentiment is generally cautious. Despite Japan's Showa Day holiday, trading volume did not shrink significantly, reflecting that institutional investors are repricing a potential "hawkish shift" by the Fed. Given the continued failure to meet the inflation target for several years, the market is focused on whether the policy statement will remove any wording related to "additional" easing, which could become the core logic guiding global asset flows in the next two to three trading days.
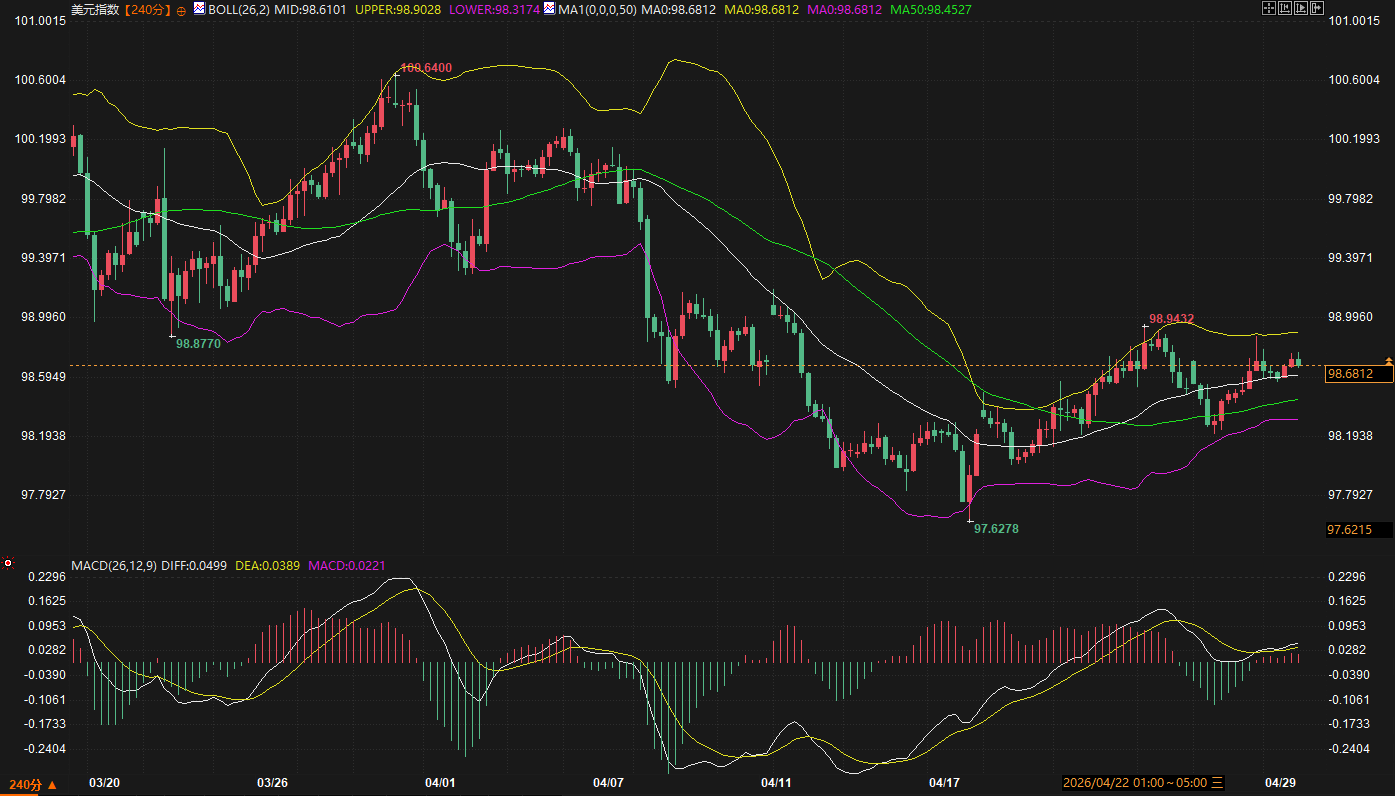
From a technical perspective, the US dollar index is currently in a high-level consolidation phase after a rebound and correction. The 240-minute chart shows that short-term moving averages have successfully crossed above medium-term moving averages, forming a golden cross, indicating a slightly bullish short-term trend. In the Bollinger Bands, the price is steadily trading between the middle band at 98.61 and the upper band at 98.90, demonstrating strong resilience. Although the MACD indicator is flattening above the zero line, indicating a slight weakening of bullish momentum, the dollar is still maintaining a generally upward trend within the 98.43 to 98.87 range.
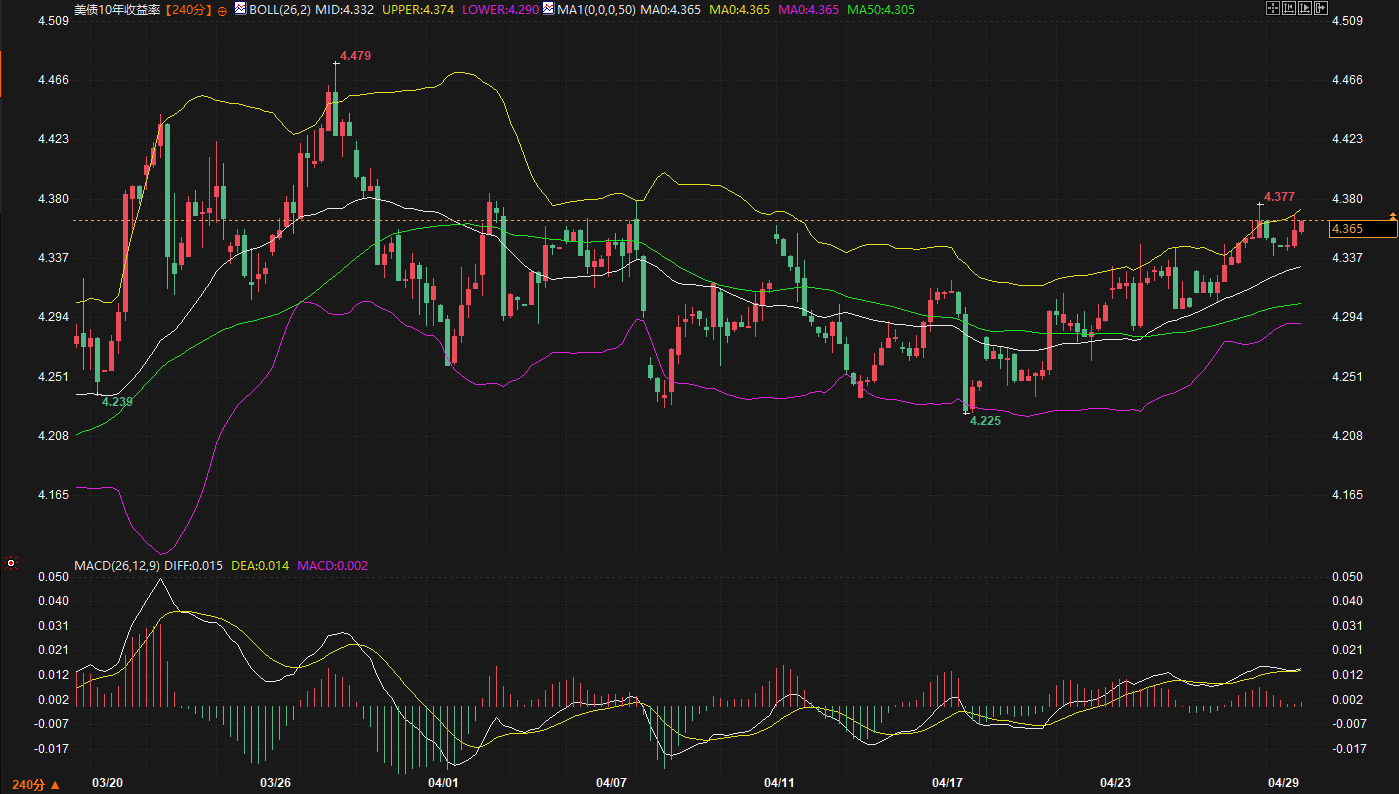
The surge in US Treasury yields is mirroring the strength of the US dollar. The 10-year Treasury yield is currently at 4.365%, with short-term moving averages showing a bullish alignment and the price closely following the upper Bollinger Band, indicating a very strong upward trend. Fundamentally, the market widely expects the Federal Reserve to maintain a high-interest-rate environment to hedge against potential future policy fluctuations and combat persistently high inflation. Analysts believe that since core inflation has been above the statutory target for six consecutive years, if the Fed demonstrates its commitment to upholding its credibility at this meeting, US Treasury yields still have the momentum to challenge the 4.38% to 4.48% resistance level in the short term. Support is seen around the 4.33% level, near the middle Bollinger Band.
Spot gold has been weak recently, pressured by rising US Treasury yields and a stronger dollar, leading to a continuous decline in prices. Looking at the 240-minute chart, the moving average system for gold is in a bearish alignment, and after hitting a recent low near 4551, the price is currently trading close to the lower Bollinger Band at 4549. Although the MACD histogram shows that bearish momentum has largely dissipated and a small bullish candlestick has appeared, suggesting a potential for a short-term technical oversold rebound, the overall weak trend remains unchanged.
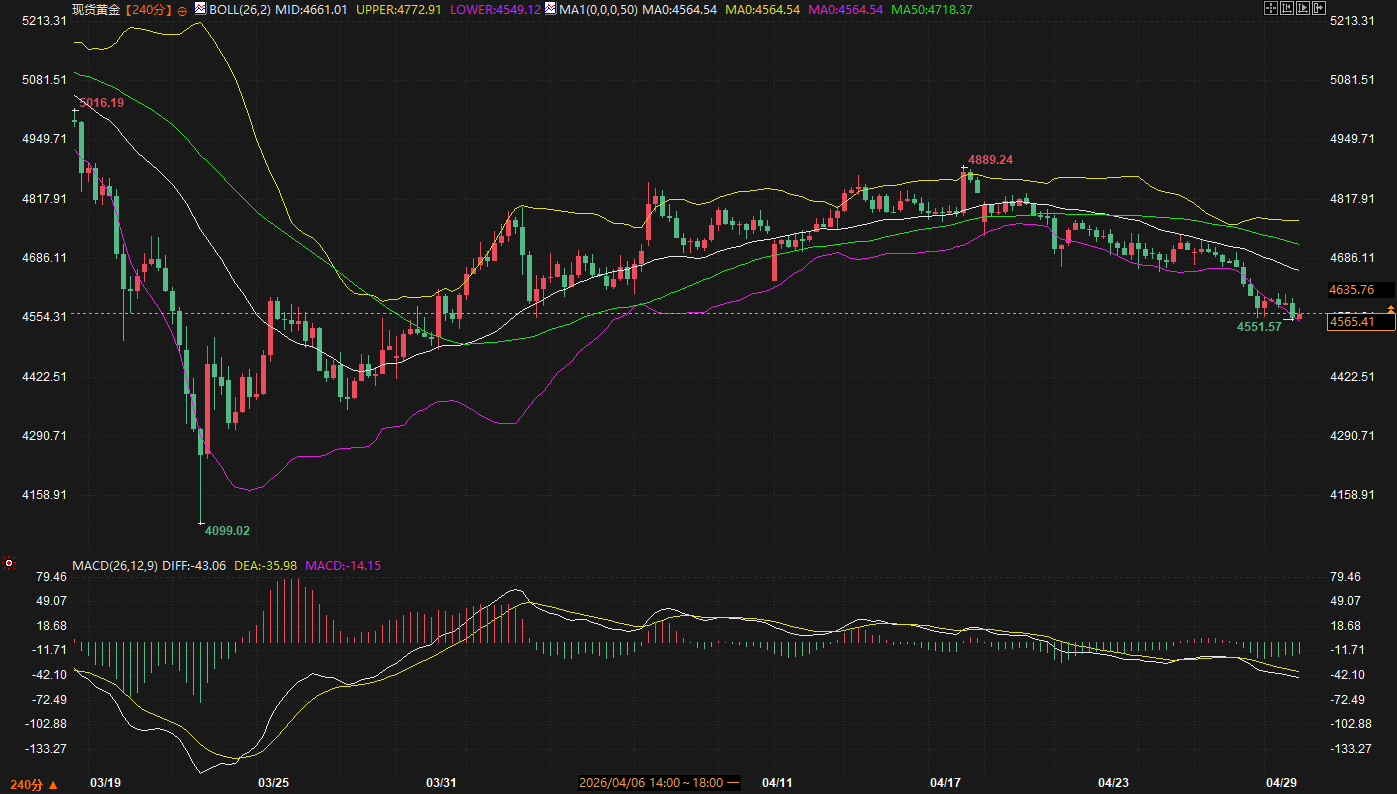
However, the fundamentals present a completely different picture. According to data from well-known institutions, central banks around the world increased their gold holdings at the fastest pace in over a year in the first quarter of this year, with net purchases reaching 244 tons. The entry of major buyers such as China and Poland effectively offset the selling pressure from some countries that were trying to make up for budget deficits or support their currencies. Analysts from well-known institutions pointed out that this gold price correction has provided an excellent entry window for official institutions that had previously adopted a wait-and-see attitude. It is expected that in the next 2-3 days, gold will seek equilibrium within the range of support at 4550 and resistance at 4660. In the long term, the continued increase in central bank holdings will build a solid bottom barrier for gold.
The crude oil market is experiencing a strong, impulsive surge. WTI crude oil prices have risen above $103, reaching a new high in nearly a month. Fundamentally, supply-side uncertainty has once again become the dominant force in the market, influenced by the ongoing Russia-Ukraine conflict and geopolitical tensions in the Middle East. From a technical perspective, the $104 level is currently the most critical resistance point. Due to the previously rapid price fluctuations, once this level is effectively broken, there is virtually no significant resistance in the $119 range.
The surge in energy prices has directly fueled long-term market expectations for global inflation. The transmission mechanism of these expectations is quite clear: rising oil prices increase transportation and production costs, forcing central banks (such as the Bank of England and the ECB) to consider more aggressive interest rate hikes to curb inflation. In this environment, the rare phenomenon of oil prices and the US dollar strengthening in tandem has further amplified the volatility of risk assets. In the next 2-3 trading days, oil price movements will be highly dependent on marginal changes in geopolitical news. Short-term resistance is seen at $104, while support is seen at the psychological level of $100.
Looking ahead to the next 2-3 trading days, the market will enter "Fed time." Given the significant rise in long-term inflation expectations from the University of Michigan in April, the Federal Reserve, in order to maintain its policy credibility, is highly likely to release hawkish signals, which will continue to support the dollar and US Treasury yields at high levels.
While gold has the technical basis for a short-term oversold rebound, the upside is expected to be limited against the backdrop of a strong dollar, and it will likely remain in a low-level consolidation phase. As for crude oil, geopolitical premiums are unlikely to dissipate in the short term, and high-level fluctuations will be the main theme. The overall strategy recommends paying close attention to the release of macroeconomic data, especially US durable goods orders and housing data, which will provide key references for judging the depth of inflation. The market is currently at a juncture of intense battle between bullish and bearish logic; investors need to pay close attention to the conversion between support and resistance levels and remain vigilant about liquidity risks.
1. Why has the price of gold continued to fall recently despite the central bank's large-scale gold purchases?
This is due to a mismatch between short-term financial logic and long-term strategic logic. In the short term, gold prices are significantly affected by rising real yields on US Treasury bonds and a stronger dollar, putting non-interest-bearing gold at a disadvantage in arbitrage trading. Central bank gold purchases, however, are a long-term strategic behavior for sovereign credit reserves, primarily aimed at asset diversification. Central bank buying typically occurs when gold prices correct, providing long-term support but failing to prevent short-term downward trends driven by the macroeconomic interest rate environment.
2. What specific impact would it have on the market if the Federal Reserve removed the word "additional" from this meeting?
Removing the word "extra" signifies that the Federal Reserve has officially ended its rate-cutting tendency since September 2024, shifting towards a neutral or even rate-raising bias. This will be interpreted by the market as an extremely hawkish signal. At that time, US Treasury yields may break through previous highs, the US dollar index is expected to challenge the 99 mark, and gold and non-US currencies will face a new round of selling pressure.
3. What is the main logic behind the current rise in crude oil prices?
The dominant logic is the supply risk premium caused by geopolitics. Due to the Russia-Ukraine situation and confrontational factors in the Middle East, crude oil supply elasticity has decreased. Furthermore, despite high global interest rates, manufacturing data from some major economies have been relatively strong, and demand has not experienced a precipitous decline. This contradiction between tight supply and robust demand has allowed speculative funds to push up oil prices.
4. Why does rising US Treasury yields suppress gold prices?
Gold, as a physical asset, does not generate interest income. When US Treasury yields (especially real interest rates) rise, the opportunity cost of holding gold increases. Investors tend to hold higher-yielding, highly liquid US Treasury bonds rather than gold, leading to capital outflows from the gold market and putting downward pressure on gold prices.
5. What economic data should we pay close attention to in the coming days?
We will focus on three key data points: first, the Federal Reserve's policy meeting statement and Powell's press conference, which are market indicators; second, US durable goods orders in March, which reflect the resilience of the manufacturing sector; and third, residential construction data for February and March, which will show the extent to which high interest rates have suppressed the real economy and energy demand.
With the Federal Reserve's April FOMC meeting entering its final decision-making phase, market sentiment is generally cautious. Despite Japan's Showa Day holiday, trading volume did not shrink significantly, reflecting that institutional investors are repricing a potential "hawkish shift" by the Fed. Given the continued failure to meet the inflation target for several years, the market is focused on whether the policy statement will remove any wording related to "additional" easing, which could become the core logic guiding global asset flows in the next two to three trading days.
US Treasury yields and the US dollar: a synchronized strengthening under tightening expectations.
From a technical perspective, the US dollar index is currently in a high-level consolidation phase after a rebound and correction. The 240-minute chart shows that short-term moving averages have successfully crossed above medium-term moving averages, forming a golden cross, indicating a slightly bullish short-term trend. In the Bollinger Bands, the price is steadily trading between the middle band at 98.61 and the upper band at 98.90, demonstrating strong resilience. Although the MACD indicator is flattening above the zero line, indicating a slight weakening of bullish momentum, the dollar is still maintaining a generally upward trend within the 98.43 to 98.87 range.
The surge in US Treasury yields is mirroring the strength of the US dollar. The 10-year Treasury yield is currently at 4.365%, with short-term moving averages showing a bullish alignment and the price closely following the upper Bollinger Band, indicating a very strong upward trend. Fundamentally, the market widely expects the Federal Reserve to maintain a high-interest-rate environment to hedge against potential future policy fluctuations and combat persistently high inflation. Analysts believe that since core inflation has been above the statutory target for six consecutive years, if the Fed demonstrates its commitment to upholding its credibility at this meeting, US Treasury yields still have the momentum to challenge the 4.38% to 4.48% resistance level in the short term. Support is seen around the 4.33% level, near the middle Bollinger Band.
Spot gold: Technical rebound after oversold conditions and support from long-term buying.
Spot gold has been weak recently, pressured by rising US Treasury yields and a stronger dollar, leading to a continuous decline in prices. Looking at the 240-minute chart, the moving average system for gold is in a bearish alignment, and after hitting a recent low near 4551, the price is currently trading close to the lower Bollinger Band at 4549. Although the MACD histogram shows that bearish momentum has largely dissipated and a small bullish candlestick has appeared, suggesting a potential for a short-term technical oversold rebound, the overall weak trend remains unchanged.
However, the fundamentals present a completely different picture. According to data from well-known institutions, central banks around the world increased their gold holdings at the fastest pace in over a year in the first quarter of this year, with net purchases reaching 244 tons. The entry of major buyers such as China and Poland effectively offset the selling pressure from some countries that were trying to make up for budget deficits or support their currencies. Analysts from well-known institutions pointed out that this gold price correction has provided an excellent entry window for official institutions that had previously adopted a wait-and-see attitude. It is expected that in the next 2-3 days, gold will seek equilibrium within the range of support at 4550 and resistance at 4660. In the long term, the continued increase in central bank holdings will build a solid bottom barrier for gold.
Crude Oil Market: Renewed Supply Premium and Transmission of Inflation Expectations
The crude oil market is experiencing a strong, impulsive surge. WTI crude oil prices have risen above $103, reaching a new high in nearly a month. Fundamentally, supply-side uncertainty has once again become the dominant force in the market, influenced by the ongoing Russia-Ukraine conflict and geopolitical tensions in the Middle East. From a technical perspective, the $104 level is currently the most critical resistance point. Due to the previously rapid price fluctuations, once this level is effectively broken, there is virtually no significant resistance in the $119 range.
The surge in energy prices has directly fueled long-term market expectations for global inflation. The transmission mechanism of these expectations is quite clear: rising oil prices increase transportation and production costs, forcing central banks (such as the Bank of England and the ECB) to consider more aggressive interest rate hikes to curb inflation. In this environment, the rare phenomenon of oil prices and the US dollar strengthening in tandem has further amplified the volatility of risk assets. In the next 2-3 trading days, oil price movements will be highly dependent on marginal changes in geopolitical news. Short-term resistance is seen at $104, while support is seen at the psychological level of $100.
Future Outlook
Looking ahead to the next 2-3 trading days, the market will enter "Fed time." Given the significant rise in long-term inflation expectations from the University of Michigan in April, the Federal Reserve, in order to maintain its policy credibility, is highly likely to release hawkish signals, which will continue to support the dollar and US Treasury yields at high levels.
While gold has the technical basis for a short-term oversold rebound, the upside is expected to be limited against the backdrop of a strong dollar, and it will likely remain in a low-level consolidation phase. As for crude oil, geopolitical premiums are unlikely to dissipate in the short term, and high-level fluctuations will be the main theme. The overall strategy recommends paying close attention to the release of macroeconomic data, especially US durable goods orders and housing data, which will provide key references for judging the depth of inflation. The market is currently at a juncture of intense battle between bullish and bearish logic; investors need to pay close attention to the conversion between support and resistance levels and remain vigilant about liquidity risks.
Frequently Asked Questions
1. Why has the price of gold continued to fall recently despite the central bank's large-scale gold purchases?
This is due to a mismatch between short-term financial logic and long-term strategic logic. In the short term, gold prices are significantly affected by rising real yields on US Treasury bonds and a stronger dollar, putting non-interest-bearing gold at a disadvantage in arbitrage trading. Central bank gold purchases, however, are a long-term strategic behavior for sovereign credit reserves, primarily aimed at asset diversification. Central bank buying typically occurs when gold prices correct, providing long-term support but failing to prevent short-term downward trends driven by the macroeconomic interest rate environment.
2. What specific impact would it have on the market if the Federal Reserve removed the word "additional" from this meeting?
Removing the word "extra" signifies that the Federal Reserve has officially ended its rate-cutting tendency since September 2024, shifting towards a neutral or even rate-raising bias. This will be interpreted by the market as an extremely hawkish signal. At that time, US Treasury yields may break through previous highs, the US dollar index is expected to challenge the 99 mark, and gold and non-US currencies will face a new round of selling pressure.
3. What is the main logic behind the current rise in crude oil prices?
The dominant logic is the supply risk premium caused by geopolitics. Due to the Russia-Ukraine situation and confrontational factors in the Middle East, crude oil supply elasticity has decreased. Furthermore, despite high global interest rates, manufacturing data from some major economies have been relatively strong, and demand has not experienced a precipitous decline. This contradiction between tight supply and robust demand has allowed speculative funds to push up oil prices.
4. Why does rising US Treasury yields suppress gold prices?
Gold, as a physical asset, does not generate interest income. When US Treasury yields (especially real interest rates) rise, the opportunity cost of holding gold increases. Investors tend to hold higher-yielding, highly liquid US Treasury bonds rather than gold, leading to capital outflows from the gold market and putting downward pressure on gold prices.
5. What economic data should we pay close attention to in the coming days?
We will focus on three key data points: first, the Federal Reserve's policy meeting statement and Powell's press conference, which are market indicators; second, US durable goods orders in March, which reflect the resilience of the manufacturing sector; and third, residential construction data for February and March, which will show the extent to which high interest rates have suppressed the real economy and energy demand.
- Risk Warning and Disclaimer
- The market involves risk, and trading may not be suitable for all investors. This article is for reference only and does not constitute personal investment advice, nor does it take into account certain users’ specific investment objectives, financial situation, or other needs. Any investment decisions made based on this information are at your own risk.