Hawkish signals from the Federal Reserve continued to pressure gold prices lower, and the weekly chart may continue its correction.
2026-04-30 09:17:57
During Thursday's Asian trading session, XAU/USD rebounded slightly but remained in a consolidation phase, nearing a four-week low, trading around $4560, indicating a clear shift in market sentiment towards caution. The core reason for this pullback was the Federal Reserve's decision to maintain interest rates and release hawkish policy signals, causing the dollar and US Treasury yields to rise in tandem, thus weakening gold's safe-haven and value-preserving appeal.
In his final press conference as Federal Reserve Chairman Jerome Powell, he stated that he would remain on the Board of Governors until the uncertainty surrounding the Fed subsides, and emphasized that the Fed's independence is facing challenges. This statement, coupled with uncertainty surrounding the policy path, has led to market divergence regarding the future direction of interest rates. Meanwhile, the Fed's meeting, which voted 8-4 to maintain interest rates in the 3.50%-3.75% range, marked the most divided meeting since 1992, further reinforcing market perceptions of policy uncertainty.
On the macroeconomic front, US core durable goods orders surged to 3.3% month-on-month, significantly higher than the previous reading and expectations, indicating continued strengthening of business investment activity, particularly increased spending in artificial intelligence-related fields. This data reinforced market assessments of economic resilience while also exacerbating concerns about a rebound in inflation. Meanwhile, the yield on the 10-year US Treasury note rose to 4.43% , and the US dollar index climbed to 98.96 , reflecting continued inflows of funds into dollar assets and directly suppressing gold prices.
From a market sentiment perspective, traders are reassessing the future path of interest rates. The market currently estimates a roughly 29% probability of a Fed rate hike by the April 2027 meeting. This expectation suggests that the market has not completely ruled out the possibility of further policy tightening, thus limiting the upside potential for gold. Since gold itself does not generate interest income, its attractiveness decreases relatively in an environment of rising or persistently high interest rates.
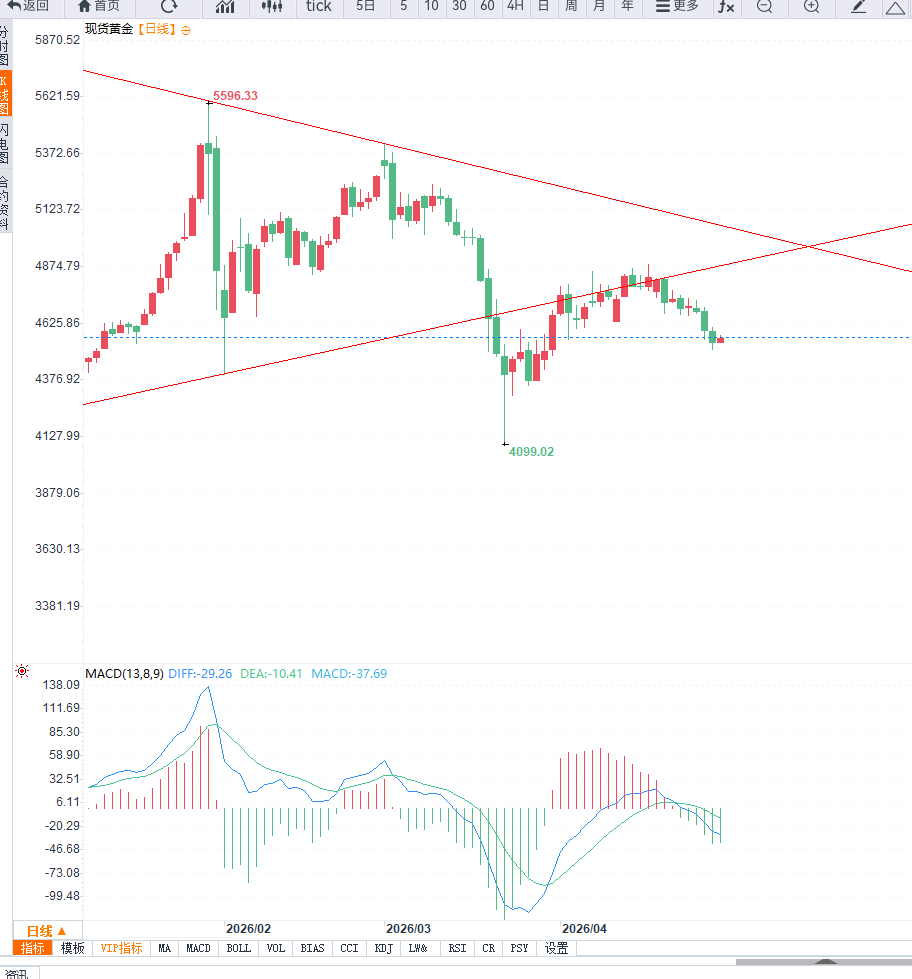
From a technical perspective, the daily chart for gold has shifted to a weak, range-bound pattern, with prices approaching the four-week low of $4,510 , indicating an overall downward trend. The current price has broken below the key $4,550 level. If it further falls below the psychological level of $4,500 , the next support levels are $4,480 and $4,350 , while the key medium- to long-term support level is around $4,260. In terms of momentum indicators, the Relative Strength Index (RSI) is approaching oversold territory, suggesting a possible short-term technical rebound, but overall bearish momentum remains dominant.
On the 4-hour chart, gold prices maintain a clear downward channel, with short-term moving averages arranged in a bearish pattern, limiting the potential for rebounds. If prices fail to regain a foothold above $4600 , the downtrend is unlikely to reverse; further resistance levels are at $4750 and $4850 . Overall, the short-term trend remains primarily one of consolidation and adjustment.
Editor's Summary:
The recent pullback in gold prices reflects a repricing of market expectations regarding interest rates and inflation. Against the backdrop of a stronger dollar and rising US Treasury yields, gold's safe-haven appeal has been suppressed, leading to a weak short-term trend. However, in the medium to long term, if inflation continues to rise or geopolitical risks escalate, gold still has the potential for a rebound. Going forward, market focus will be on the Federal Reserve's policy path and changes in inflation data; investors need to remain cautious in a highly volatile environment.
In his final press conference as Federal Reserve Chairman Jerome Powell, he stated that he would remain on the Board of Governors until the uncertainty surrounding the Fed subsides, and emphasized that the Fed's independence is facing challenges. This statement, coupled with uncertainty surrounding the policy path, has led to market divergence regarding the future direction of interest rates. Meanwhile, the Fed's meeting, which voted 8-4 to maintain interest rates in the 3.50%-3.75% range, marked the most divided meeting since 1992, further reinforcing market perceptions of policy uncertainty.
On the macroeconomic front, US core durable goods orders surged to 3.3% month-on-month, significantly higher than the previous reading and expectations, indicating continued strengthening of business investment activity, particularly increased spending in artificial intelligence-related fields. This data reinforced market assessments of economic resilience while also exacerbating concerns about a rebound in inflation. Meanwhile, the yield on the 10-year US Treasury note rose to 4.43% , and the US dollar index climbed to 98.96 , reflecting continued inflows of funds into dollar assets and directly suppressing gold prices.
From a market sentiment perspective, traders are reassessing the future path of interest rates. The market currently estimates a roughly 29% probability of a Fed rate hike by the April 2027 meeting. This expectation suggests that the market has not completely ruled out the possibility of further policy tightening, thus limiting the upside potential for gold. Since gold itself does not generate interest income, its attractiveness decreases relatively in an environment of rising or persistently high interest rates.
From a technical perspective, the daily chart for gold has shifted to a weak, range-bound pattern, with prices approaching the four-week low of $4,510 , indicating an overall downward trend. The current price has broken below the key $4,550 level. If it further falls below the psychological level of $4,500 , the next support levels are $4,480 and $4,350 , while the key medium- to long-term support level is around $4,260. In terms of momentum indicators, the Relative Strength Index (RSI) is approaching oversold territory, suggesting a possible short-term technical rebound, but overall bearish momentum remains dominant.
On the 4-hour chart, gold prices maintain a clear downward channel, with short-term moving averages arranged in a bearish pattern, limiting the potential for rebounds. If prices fail to regain a foothold above $4600 , the downtrend is unlikely to reverse; further resistance levels are at $4750 and $4850 . Overall, the short-term trend remains primarily one of consolidation and adjustment.
Editor's Summary:
The recent pullback in gold prices reflects a repricing of market expectations regarding interest rates and inflation. Against the backdrop of a stronger dollar and rising US Treasury yields, gold's safe-haven appeal has been suppressed, leading to a weak short-term trend. However, in the medium to long term, if inflation continues to rise or geopolitical risks escalate, gold still has the potential for a rebound. Going forward, market focus will be on the Federal Reserve's policy path and changes in inflation data; investors need to remain cautious in a highly volatile environment.
- Risk Warning and Disclaimer
- The market involves risk, and trading may not be suitable for all investors. This article is for reference only and does not constitute personal investment advice, nor does it take into account certain users’ specific investment objectives, financial situation, or other needs. Any investment decisions made based on this information are at your own risk.