Speculative funds have already exited, and after the oil price plunged from its high, what reason is there for it not to break $100 next week?
2026-05-02 10:47:41
This week, the international crude oil market experienced a dramatic shift from extreme euphoria to sharp fluctuations at high levels. Influenced by the ongoing developments in the Russia-Ukraine situation and the intertwined geopolitical tensions in the Middle East, oil prices initially continued the upward momentum driven by the Strait of Hormuz blockade, with both WTI and Brent crude reaching near-year highs. However, with the release of news on Friday that Iran had submitted a peace negotiation proposal to the mediators , market concerns about supply disruptions structurally eased, leading to rapid profit-taking and a significant drop in prices on that day.

From a core perspective, the market is currently caught in a tug-of-war between the retracement of geopolitical premiums and actual supply-side disruptions . While Iran's proposal leaves room for a diplomatic solution, the deep distrust displayed by neighboring countries like the UAE, and the continued control of export channels by the US Navy, mean that the premium cannot be completely dissipated in the short term. Furthermore, macroeconomic pressures cannot be ignored; the market is closely watching whether inflationary pressures triggered by high oil prices will force major central banks to maintain a high-interest-rate environment for an extended period.
Weekly Market Recap: US crude oil closed at $104.41 per barrel this week, recording a strong weekly gain of 8.03%. However, the market's strength suffered a major setback on Friday, with a single-day drop of 2.76%. After reaching a high above $109, prices succumbed to selling pressure due to news of negotiations, and further declined to around $102.50 per barrel in after-hours trading.
Economic Data/Event Summary: The key variable lies in the expectation of a de-escalation in geopolitical tensions . On Friday morning, major overseas institutions cited Iran's state news agency, reporting that Tehran had submitted a new proposal to Pakistan for negotiations with the United States. This change directly offset the supply risk premium previously incurred due to the potential blockade of the Strait of Hormuz. Meanwhile, the latest CFTC positioning data shows that, as of the week ending April 28, speculators reduced their net long positions in US crude oil by 3,416 contracts, indicating that smart money has diverged at higher levels and has begun a strategic retreat.
Summary of institutional viewpoints: Analysts from major overseas institutions pointed out that the long upper shadow and large bearish candlestick pattern on Friday's daily chart for US crude oil is a clear short-term top signal. Technically, the MACD lines have turned downwards above the zero line, indicating that bullish momentum is rapidly weakening. Some analysts believe that if the price cannot stabilize above the $100 mark next week, it may retrace to the Bollinger Band middle line (98.24) to seek support.
Weekly Market Recap: Brent crude oil rose 2.45% for the week, closing at $111.15 per barrel. Although it maintained positive growth for the week, its rebound was significantly weaker than that of WTI crude. On Thursday, the Brent near-month contract touched an extreme high of $126.41, but subsequently, due to a reversal in market sentiment, it closed with a medium-sized bearish candlestick on Friday, falling 2.13% to $108.78 per barrel.
Economic Data/Event Summary: Market focus is on supply sustainability . While Iran has proposed negotiations, geopolitical trust remains fragile. An advisor to the UAE president explicitly stated that Iran's unilateral arrangements regarding key shipping lanes are unreliable, exacerbating market concerns about a "negotiations while blockading" situation. Meanwhile, high global inflation and soaring energy costs are prompting the market to reassess the risks of suppressed demand.
Summary of institutional viewpoints: A well-known foreign media analysis team believes that Brent crude oil is currently trading within a parallel Bollinger Band. Although short-term pressure is evident, it remains within a bullish range above the middle band (102.32). Investment institutions indicate that current oil price fluctuations are entirely driven by marginal changes in geopolitics . Until a substantial breakthrough is achieved in negotiations, the $105 to $115 range may become the new pivot point for price fluctuations.
In summary, this week's performance in the international oil market indicates that geopolitical maneuvering has entered a new phase of "negotiation over confrontation." The sharp drop in oil prices from their highs is essentially a process of the market repricing extreme supply risks. Trade expectation fluctuations triggered by tariff rhetoric , coupled with uncertainties in the Middle East, weakened crude oil's safe-haven asset status towards the end of the week.
Looking ahead to next week, investors should focus on two key areas: first, substantive feedback on the Iranian negotiating proposals; if the US stance remains hardline, geopolitical premiums may return; second, expectations regarding the interest rate paths of major global central banks. As some analysts have noted, if falling energy prices lead to a decline in inflation expectations, it could provide room for a shift in subsequent monetary policy. In the short term, the technical correction following overbought conditions is not yet over, and attention should be paid to the resilience of US oil prices around the $100 mark.
Why did Iran's proposal for peace talks have such a sharp downward impact on oil prices?
A: The core logic lies in the rapid clearing of geopolitical premiums . Since the escalation of the situation at the end of February, the rise in oil prices largely reflected the extreme expectation that a complete blockade of the Strait of Hormuz would disrupt one-fifth of the global crude oil supply. When Iran expressed its willingness to negotiate through mediators, the market interpreted it as a signal that the extreme standoff might be broken. This reversal of "risk aversion expectations" triggered a concentrated exit of previously profitable long positions. Given that oil prices are currently at relatively high historical levels, liquidity is highly sensitive to the diminishing marginal returns of positive news; therefore, even minor adjustments in news are enough to trigger a deep correction of around 3% in a single day.
How should we interpret the actions of managed funds reducing their net long positions in US crude oil as reported in the CFTC report?
A: Changes in CFTC positioning are generally considered a leading indicator of institutional investor sentiment. Data as of April 28th shows that managed funds reduced their net long positions by over 3,000 contracts, indicating that professional funds were already wary of the risks of high-level volatility prior to Friday's sharp decline. This reduction reflects institutional skepticism about the sustainability of oil prices breaking through $110, especially given the protracted Russia-Ukraine conflict and its dampening effect on global economic growth; high oil prices themselves are undermining demand. The early withdrawal of institutions, coupled with negative news on Friday, accelerated the downward search for support.
What implications do the questions raised by UAE officials regarding the Iranian proposal have for future oil price trends?
A: This indicates that geopolitical risks have not been completely eliminated , but rather have entered a complex period of tug-of-war. The distrust expressed by the UAE reflects deep-seated contradictions among Middle Eastern oil-producing countries, meaning that even if Iran is willing to negotiate, navigational safety in the Strait of Hormuz and the lifting of sanctions cannot be achieved overnight. For traders, this distrust creates a "safety cushion" for oil prices, meaning that a precipitous drop back to pre-war levels is unlikely, as actual supply threats and diplomatic maneuvering remain.
How do oil price fluctuations affect gold and monetary policy expectations through macroeconomic pathways?
A: Energy prices are the engine of inflation. If the situation in Iran eases and oil prices continue to fall, it will directly alleviate global inflationary pressures. This provides major central banks (such as the Federal Reserve) with a window to slow the pace of interest rate hikes or initiate rate cuts . As market observers have pointed out, lower energy costs could lead to a weaker US dollar index, which in turn would benefit non-standard assets such as gold. Gold's rebound this week after the decline in oil prices is based on the macroeconomic transmission chain of "peace expectations → cooling inflation → lower interest rate expectations → weaker US dollar".
From a technical analysis perspective, does Friday's long upper shadow candlestick pattern in US crude oil signal the end of the bull market?
A: It's too early to conclude the bull market is over, but the signals for a mid-term correction are very clear. A long upper shadow on the daily chart typically indicates strong resistance at higher levels. The price's rapid pullback after touching the upper Bollinger Band and approaching the middle band suggests the bullish structure has been broken. The MACD indicator's death cross also hints that the market may enter a consolidation phase in the coming week. The key level to watch is the support level in the $98-$100 range. If this range is broken decisively, it means the market will shift from geopolitical drivers to pricing in a macroeconomic recession.
From a core perspective, the market is currently caught in a tug-of-war between the retracement of geopolitical premiums and actual supply-side disruptions . While Iran's proposal leaves room for a diplomatic solution, the deep distrust displayed by neighboring countries like the UAE, and the continued control of export channels by the US Navy, mean that the premium cannot be completely dissipated in the short term. Furthermore, macroeconomic pressures cannot be ignored; the market is closely watching whether inflationary pressures triggered by high oil prices will force major central banks to maintain a high-interest-rate environment for an extended period.
[Detailed Review by Variety]
1. Analysis of US Crude Oil (WTI) Trends
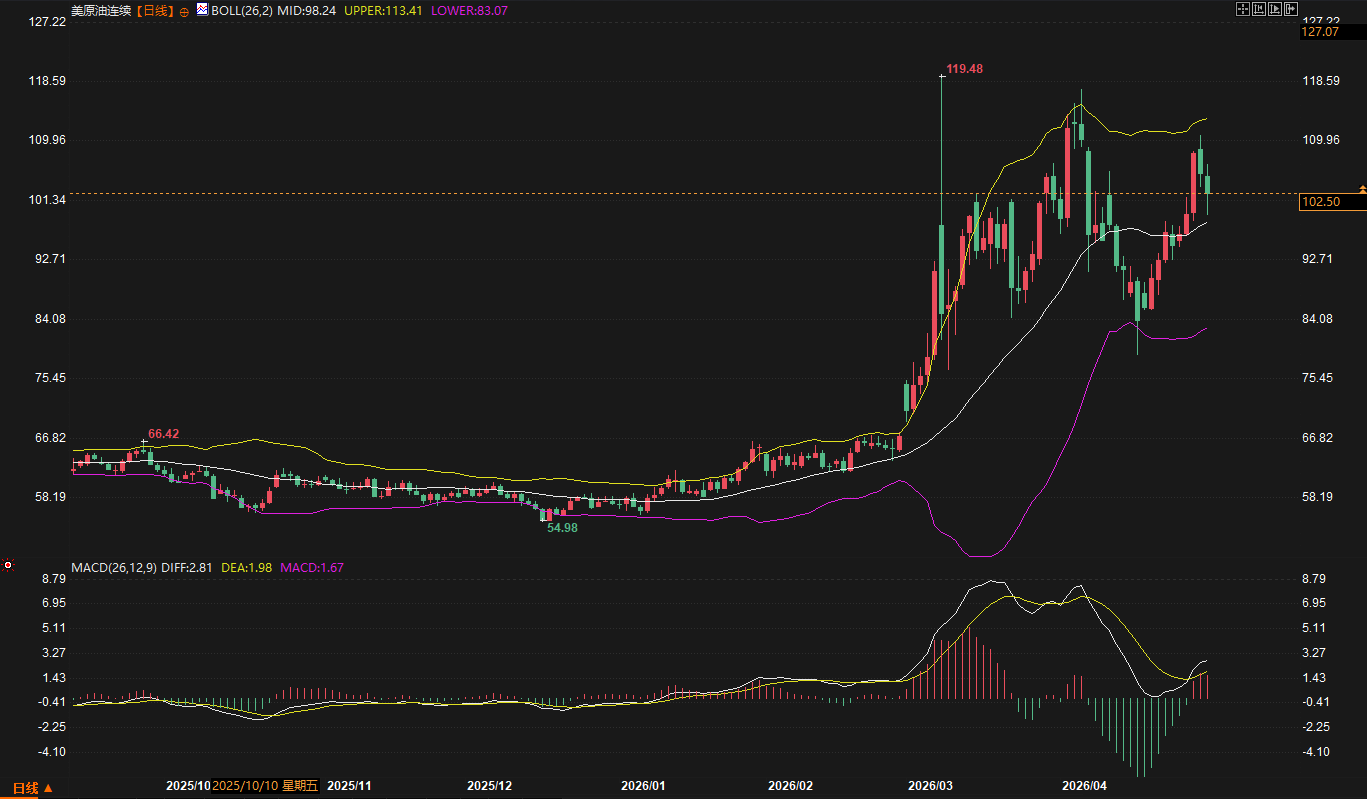
Weekly Market Recap: US crude oil closed at $104.41 per barrel this week, recording a strong weekly gain of 8.03%. However, the market's strength suffered a major setback on Friday, with a single-day drop of 2.76%. After reaching a high above $109, prices succumbed to selling pressure due to news of negotiations, and further declined to around $102.50 per barrel in after-hours trading.
Economic Data/Event Summary: The key variable lies in the expectation of a de-escalation in geopolitical tensions . On Friday morning, major overseas institutions cited Iran's state news agency, reporting that Tehran had submitted a new proposal to Pakistan for negotiations with the United States. This change directly offset the supply risk premium previously incurred due to the potential blockade of the Strait of Hormuz. Meanwhile, the latest CFTC positioning data shows that, as of the week ending April 28, speculators reduced their net long positions in US crude oil by 3,416 contracts, indicating that smart money has diverged at higher levels and has begun a strategic retreat.
Summary of institutional viewpoints: Analysts from major overseas institutions pointed out that the long upper shadow and large bearish candlestick pattern on Friday's daily chart for US crude oil is a clear short-term top signal. Technically, the MACD lines have turned downwards above the zero line, indicating that bullish momentum is rapidly weakening. Some analysts believe that if the price cannot stabilize above the $100 mark next week, it may retrace to the Bollinger Band middle line (98.24) to seek support.
2. Brent Crude Oil Price Analysis
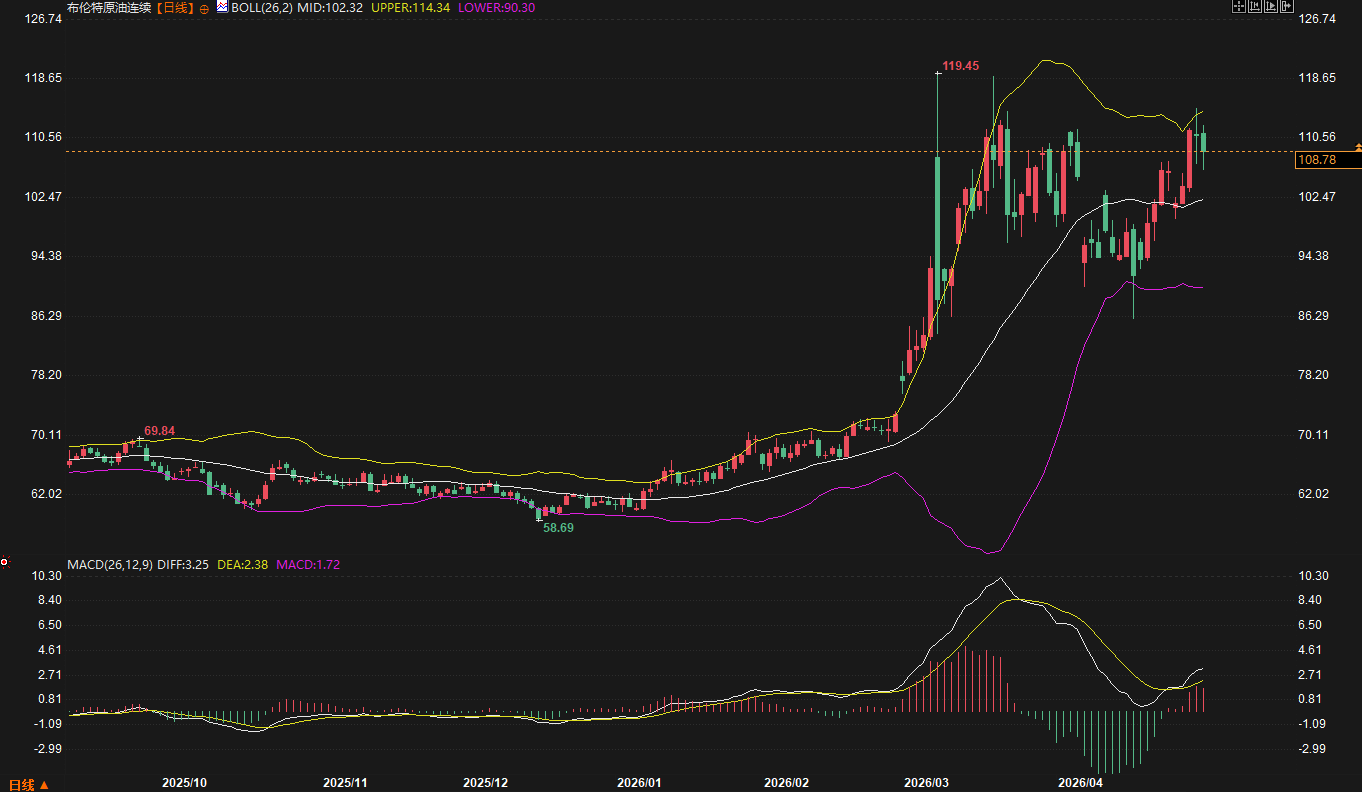
Weekly Market Recap: Brent crude oil rose 2.45% for the week, closing at $111.15 per barrel. Although it maintained positive growth for the week, its rebound was significantly weaker than that of WTI crude. On Thursday, the Brent near-month contract touched an extreme high of $126.41, but subsequently, due to a reversal in market sentiment, it closed with a medium-sized bearish candlestick on Friday, falling 2.13% to $108.78 per barrel.
Economic Data/Event Summary: Market focus is on supply sustainability . While Iran has proposed negotiations, geopolitical trust remains fragile. An advisor to the UAE president explicitly stated that Iran's unilateral arrangements regarding key shipping lanes are unreliable, exacerbating market concerns about a "negotiations while blockading" situation. Meanwhile, high global inflation and soaring energy costs are prompting the market to reassess the risks of suppressed demand.
Summary of institutional viewpoints: A well-known foreign media analysis team believes that Brent crude oil is currently trading within a parallel Bollinger Band. Although short-term pressure is evident, it remains within a bullish range above the middle band (102.32). Investment institutions indicate that current oil price fluctuations are entirely driven by marginal changes in geopolitics . Until a substantial breakthrough is achieved in negotiations, the $105 to $115 range may become the new pivot point for price fluctuations.
In summary, this week's performance in the international oil market indicates that geopolitical maneuvering has entered a new phase of "negotiation over confrontation." The sharp drop in oil prices from their highs is essentially a process of the market repricing extreme supply risks. Trade expectation fluctuations triggered by tariff rhetoric , coupled with uncertainties in the Middle East, weakened crude oil's safe-haven asset status towards the end of the week.
Looking ahead to next week, investors should focus on two key areas: first, substantive feedback on the Iranian negotiating proposals; if the US stance remains hardline, geopolitical premiums may return; second, expectations regarding the interest rate paths of major global central banks. As some analysts have noted, if falling energy prices lead to a decline in inflation expectations, it could provide room for a shift in subsequent monetary policy. In the short term, the technical correction following overbought conditions is not yet over, and attention should be paid to the resilience of US oil prices around the $100 mark.
QA module
Why did Iran's proposal for peace talks have such a sharp downward impact on oil prices?
A: The core logic lies in the rapid clearing of geopolitical premiums . Since the escalation of the situation at the end of February, the rise in oil prices largely reflected the extreme expectation that a complete blockade of the Strait of Hormuz would disrupt one-fifth of the global crude oil supply. When Iran expressed its willingness to negotiate through mediators, the market interpreted it as a signal that the extreme standoff might be broken. This reversal of "risk aversion expectations" triggered a concentrated exit of previously profitable long positions. Given that oil prices are currently at relatively high historical levels, liquidity is highly sensitive to the diminishing marginal returns of positive news; therefore, even minor adjustments in news are enough to trigger a deep correction of around 3% in a single day.
How should we interpret the actions of managed funds reducing their net long positions in US crude oil as reported in the CFTC report?
A: Changes in CFTC positioning are generally considered a leading indicator of institutional investor sentiment. Data as of April 28th shows that managed funds reduced their net long positions by over 3,000 contracts, indicating that professional funds were already wary of the risks of high-level volatility prior to Friday's sharp decline. This reduction reflects institutional skepticism about the sustainability of oil prices breaking through $110, especially given the protracted Russia-Ukraine conflict and its dampening effect on global economic growth; high oil prices themselves are undermining demand. The early withdrawal of institutions, coupled with negative news on Friday, accelerated the downward search for support.
What implications do the questions raised by UAE officials regarding the Iranian proposal have for future oil price trends?
A: This indicates that geopolitical risks have not been completely eliminated , but rather have entered a complex period of tug-of-war. The distrust expressed by the UAE reflects deep-seated contradictions among Middle Eastern oil-producing countries, meaning that even if Iran is willing to negotiate, navigational safety in the Strait of Hormuz and the lifting of sanctions cannot be achieved overnight. For traders, this distrust creates a "safety cushion" for oil prices, meaning that a precipitous drop back to pre-war levels is unlikely, as actual supply threats and diplomatic maneuvering remain.
How do oil price fluctuations affect gold and monetary policy expectations through macroeconomic pathways?
A: Energy prices are the engine of inflation. If the situation in Iran eases and oil prices continue to fall, it will directly alleviate global inflationary pressures. This provides major central banks (such as the Federal Reserve) with a window to slow the pace of interest rate hikes or initiate rate cuts . As market observers have pointed out, lower energy costs could lead to a weaker US dollar index, which in turn would benefit non-standard assets such as gold. Gold's rebound this week after the decline in oil prices is based on the macroeconomic transmission chain of "peace expectations → cooling inflation → lower interest rate expectations → weaker US dollar".
From a technical analysis perspective, does Friday's long upper shadow candlestick pattern in US crude oil signal the end of the bull market?
A: It's too early to conclude the bull market is over, but the signals for a mid-term correction are very clear. A long upper shadow on the daily chart typically indicates strong resistance at higher levels. The price's rapid pullback after touching the upper Bollinger Band and approaching the middle band suggests the bullish structure has been broken. The MACD indicator's death cross also hints that the market may enter a consolidation phase in the coming week. The key level to watch is the support level in the $98-$100 range. If this range is broken decisively, it means the market will shift from geopolitical drivers to pricing in a macroeconomic recession.
- Risk Warning and Disclaimer
- The market involves risk, and trading may not be suitable for all investors. This article is for reference only and does not constitute personal investment advice, nor does it take into account certain users’ specific investment objectives, financial situation, or other needs. Any investment decisions made based on this information are at your own risk.