Soaring oil prices trigger interest rate hike concerns, causing gold prices to plummet.
2026-05-05 01:08:19
On Monday (May 4), spot gold fell 2.3%, with selling pressure stemming from three main factors: soaring oil prices, rising yields, and a stronger US dollar. Due to holidays in China, Japan, and the UK, market volume was thin, amplifying volatility. Gold prices briefly broke below the $4,550 support level, hitting a low of $4,509.5. The following analysis examines the driving factors and technical trends behind this sell-off.

Technical Outlook
On the daily chart, spot gold came under significant pressure on Monday, falling 2.3% and breaking below the low of the main support range. The bulls' defense was broken, and there were clear signs of a one-sided downward trend.
Gold's main trading range was $3886.46-$5602.23, with key support levels at $4744.34-$4541.88 (50%-61.8% retracement level). Gold prices oscillated within this range throughout April, but after a 2.3% drop, breaking below the key support level of $4541.88, the stalemate between bulls and bears was broken, and bearish momentum dominated the market.
The short-term trading range is $4099.12-$4891.54, with secondary support at $4495.33-$4401.84. After breaking below the major support, gold prices will focus on testing this range, and if it falls below this level, it may further test the $4400 mark.
The medium-term resistance level is $4850.68-$5028.04. On April 17, gold prices rebounded to $4891.54 but were suppressed by this level and fell back. After this extended decline, the resistance to the rebound has intensified, and a break above $4744.34 is needed for a recovery.
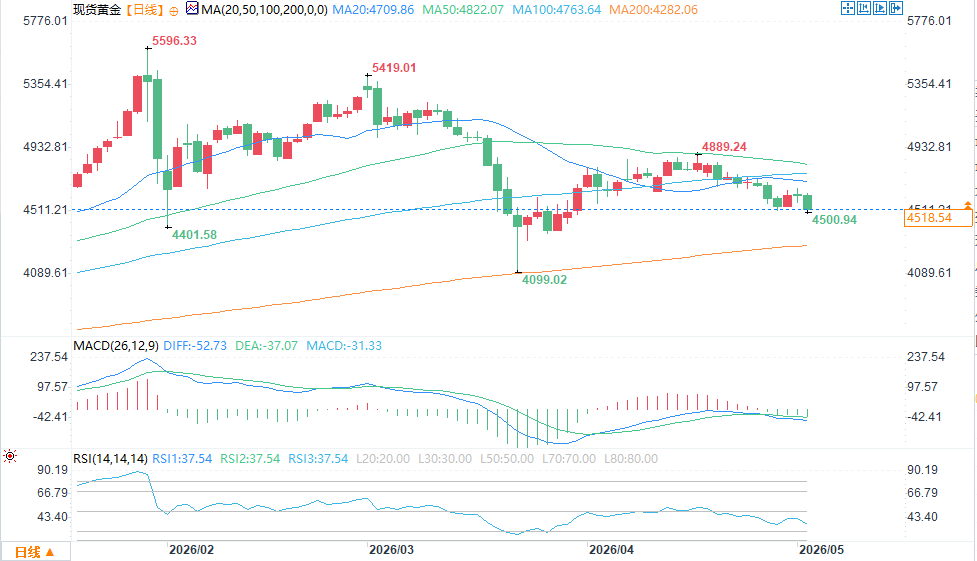
(Spot gold daily chart source: FX678)
In terms of moving averages, the 50-day moving average at $4821.62 is forming resistance, while the 200-day moving average at $4282.43 is a key long-term support level. Currently, gold prices are far from the 50-day moving average, indicating significant pressure for a short-term rebound. If the support level cannot be recovered, prices may move closer to the 200-day moving average.
In summary, the gold market has broken out of its consolidation phase, with a 2.3% drop indicating the beginning of a one-sided downward trend. The previous strategy of "selling on rallies and buying on dips" is no longer applicable, and the combination of multiple negative factors has led to the dominance of the bears.
Historical data shows that the market spends 70% of its time in sideways trading and 30% in trending markets. Currently, gold prices have entered a downward trend phase. Risk control is the core strategy, and it is not advisable to blindly buy the dip. Chasing highs and selling lows requires extra caution.
Trading volume is a key indicator. Although trading volume was light during this decline, it increased somewhat, reflecting stronger selling pressure from short sellers. Continued increases in trading volume will push gold prices further down. A pullback might lead to a short-term technical rebound, but the overall downward trend is unlikely to change.
Oil prices trigger a chain reaction
On the daily chart, rumors of a warship attack in the Strait of Hormuz pushed Brent crude oil above $110 per barrel, reaching a high of $114.30, a gain of over 5.6%. Despite the US denying the rumors, the oil market did not see a significant pullback, with geopolitical premiums persisting. Rising oil prices increased inflation expectations and reduced the probability of interest rate cuts, directly leading to a 2.3% drop in gold prices.
Gold prices continue to be pressured by yields.
The yield on the 10-year US Treasury note climbed to 4.429%, and the 2-year yield approached 3.94%, both near recent highs, significantly increasing the opportunity cost of holding gold. Gold lacks yield-generating properties, and with no signs of a Federal Reserve rate cut, funds are flowing into higher-yielding assets. This, coupled with rising oil prices, has pushed gold prices down to 2.3%, and this downward pressure is unlikely to ease in the short term.
The dollar exacerbates the gold price predicament.
The US dollar index continues to strengthen, remaining above the 98.00 level, becoming the third major factor suppressing gold prices. Safe-haven funds are flowing into the US dollar rather than gold, and the stronger dollar increases the global cost of gold purchases, further reducing demand. Coupled with the downward trend amplifying the decline, this will continue to suppress gold prices in the short term.
The Federal Reserve will maintain its current policy unchanged.
The Federal Reserve kept interest rates unchanged last week, with officials taking a hawkish stance against short-term easing, and three hawkish dissents emerging during the meeting. Rising oil prices exacerbated inflation risks, prompting some policymakers to reconsider rate hikes, thus setting a ceiling for gold price increases and contributing significantly to the 2.3% drop in gold prices. In the short term, gold bulls lack support from easing policies.
Key indicators to watch
This week's April non-farm payroll report will be a market catalyst: stronger-than-expected data will further suppress gold prices, while weaker-than-expected data may push yields down, providing a short-term rebound opportunity for gold prices. Currently, the market still favors the bears, and the 2.3% drop already reflects the dominant bearish sentiment.
The secondary support range of $4495.33-$4401.84 is key for bulls to enter the market. It is necessary to continue to pay attention to oil prices, yields, the dollar's trend and geopolitical factors. If the negative factors continue, gold prices may fall further, and short-term rebounds are unlikely to change the downward trend.
At 01:06 Beijing time, spot gold was trading at $4,524.20 per ounce, down 1.99%.
Technical Outlook
On the daily chart, spot gold came under significant pressure on Monday, falling 2.3% and breaking below the low of the main support range. The bulls' defense was broken, and there were clear signs of a one-sided downward trend.
Gold's main trading range was $3886.46-$5602.23, with key support levels at $4744.34-$4541.88 (50%-61.8% retracement level). Gold prices oscillated within this range throughout April, but after a 2.3% drop, breaking below the key support level of $4541.88, the stalemate between bulls and bears was broken, and bearish momentum dominated the market.
The short-term trading range is $4099.12-$4891.54, with secondary support at $4495.33-$4401.84. After breaking below the major support, gold prices will focus on testing this range, and if it falls below this level, it may further test the $4400 mark.
The medium-term resistance level is $4850.68-$5028.04. On April 17, gold prices rebounded to $4891.54 but were suppressed by this level and fell back. After this extended decline, the resistance to the rebound has intensified, and a break above $4744.34 is needed for a recovery.
(Spot gold daily chart source: FX678)
In terms of moving averages, the 50-day moving average at $4821.62 is forming resistance, while the 200-day moving average at $4282.43 is a key long-term support level. Currently, gold prices are far from the 50-day moving average, indicating significant pressure for a short-term rebound. If the support level cannot be recovered, prices may move closer to the 200-day moving average.
In summary, the gold market has broken out of its consolidation phase, with a 2.3% drop indicating the beginning of a one-sided downward trend. The previous strategy of "selling on rallies and buying on dips" is no longer applicable, and the combination of multiple negative factors has led to the dominance of the bears.
Historical data shows that the market spends 70% of its time in sideways trading and 30% in trending markets. Currently, gold prices have entered a downward trend phase. Risk control is the core strategy, and it is not advisable to blindly buy the dip. Chasing highs and selling lows requires extra caution.
Trading volume is a key indicator. Although trading volume was light during this decline, it increased somewhat, reflecting stronger selling pressure from short sellers. Continued increases in trading volume will push gold prices further down. A pullback might lead to a short-term technical rebound, but the overall downward trend is unlikely to change.
Oil prices trigger a chain reaction
On the daily chart, rumors of a warship attack in the Strait of Hormuz pushed Brent crude oil above $110 per barrel, reaching a high of $114.30, a gain of over 5.6%. Despite the US denying the rumors, the oil market did not see a significant pullback, with geopolitical premiums persisting. Rising oil prices increased inflation expectations and reduced the probability of interest rate cuts, directly leading to a 2.3% drop in gold prices.
Gold prices continue to be pressured by yields.
The yield on the 10-year US Treasury note climbed to 4.429%, and the 2-year yield approached 3.94%, both near recent highs, significantly increasing the opportunity cost of holding gold. Gold lacks yield-generating properties, and with no signs of a Federal Reserve rate cut, funds are flowing into higher-yielding assets. This, coupled with rising oil prices, has pushed gold prices down to 2.3%, and this downward pressure is unlikely to ease in the short term.
The dollar exacerbates the gold price predicament.
The US dollar index continues to strengthen, remaining above the 98.00 level, becoming the third major factor suppressing gold prices. Safe-haven funds are flowing into the US dollar rather than gold, and the stronger dollar increases the global cost of gold purchases, further reducing demand. Coupled with the downward trend amplifying the decline, this will continue to suppress gold prices in the short term.
The Federal Reserve will maintain its current policy unchanged.
The Federal Reserve kept interest rates unchanged last week, with officials taking a hawkish stance against short-term easing, and three hawkish dissents emerging during the meeting. Rising oil prices exacerbated inflation risks, prompting some policymakers to reconsider rate hikes, thus setting a ceiling for gold price increases and contributing significantly to the 2.3% drop in gold prices. In the short term, gold bulls lack support from easing policies.
Key indicators to watch
This week's April non-farm payroll report will be a market catalyst: stronger-than-expected data will further suppress gold prices, while weaker-than-expected data may push yields down, providing a short-term rebound opportunity for gold prices. Currently, the market still favors the bears, and the 2.3% drop already reflects the dominant bearish sentiment.
The secondary support range of $4495.33-$4401.84 is key for bulls to enter the market. It is necessary to continue to pay attention to oil prices, yields, the dollar's trend and geopolitical factors. If the negative factors continue, gold prices may fall further, and short-term rebounds are unlikely to change the downward trend.
At 01:06 Beijing time, spot gold was trading at $4,524.20 per ounce, down 1.99%.
- Risk Warning and Disclaimer
- The market involves risk, and trading may not be suitable for all investors. This article is for reference only and does not constitute personal investment advice, nor does it take into account certain users’ specific investment objectives, financial situation, or other needs. Any investment decisions made based on this information are at your own risk.