The yen plunged by 32 billion yen, and US Treasury bonds suffered a double blow and fell back! Gold is heading towards a key resistance level; will tomorrow night's non-farm payrolls report change the course of events?
2026-05-07 19:51:50
On Thursday (May 7th), global financial markets were in a sensitive period of interplay due to a confluence of factors. Inflation expectations accumulated due to tariff rhetoric, and the spillover effects of the Russia-Ukraine conflict in the Middle East, market sentiment fluctuated between risk aversion and recovery expectations. Recent data from a well-known institution shows that although solutions for easing tensions between the US and Iran are under discussion, core issues such as the safety of passage through the Strait of Hormuz remain unresolved. The US dollar index and US Treasury yields, after their previous rebound, have exhausted their momentum and are currently declining in tandem, while spot gold has been boosted, demonstrating strong bullish momentum.
Even with expectations of a peace agreement circulating in the market, crude oil prices did not experience a precipitous drop, but instead demonstrated remarkable resilience. Behind this "seeking to fall but holding on" trend lies the long-term structural risks on the supply side. A well-known institution revealed that due to the potential threat from the Strait of Hormuz, some oil-producing countries, such as the UAE, have had to resort to extreme measures such as disabling location trackers when passing through the strait. This high risk premium has already been passed on to downstream refining and aviation industry costs.
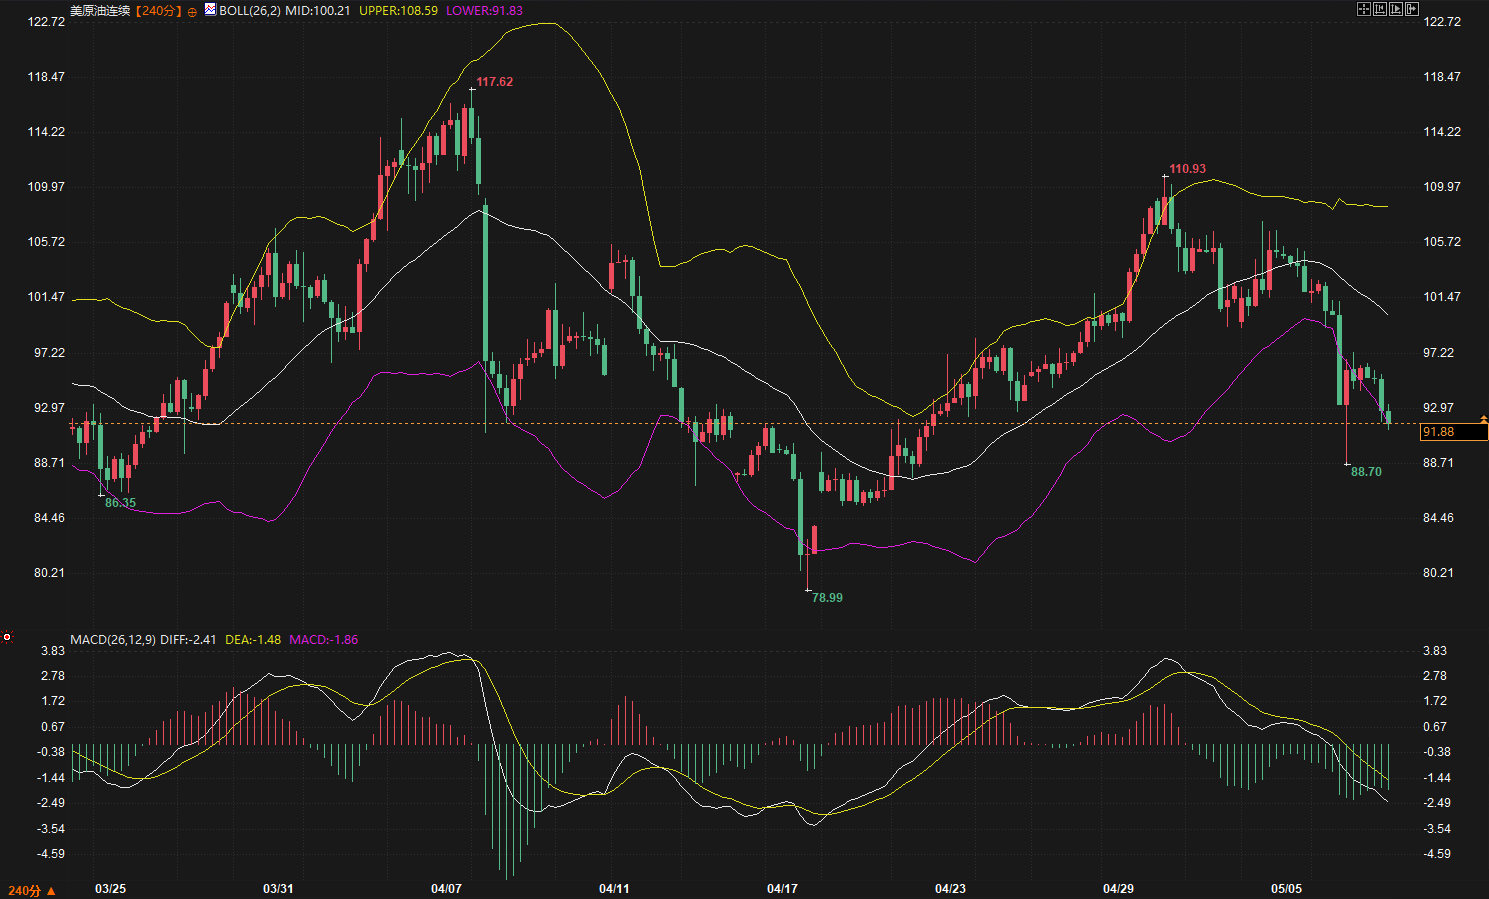
From a technical perspective, crude oil is currently trading within a wide range of $83 to $100 . Global inventory reduction, particularly the shortages in European and Asian markets, provides solid support for oil prices. In the short term, the market's reaction to diplomatic efforts is muted, focusing more on structural uncertainties. If the situation in the Middle East fails to provide substantial guarantees for passage through the Straits of Hormuz, crude oil prices will remain high. Technical analysis suggests that a pullback to the $83-$84 range is expected to form strong support.
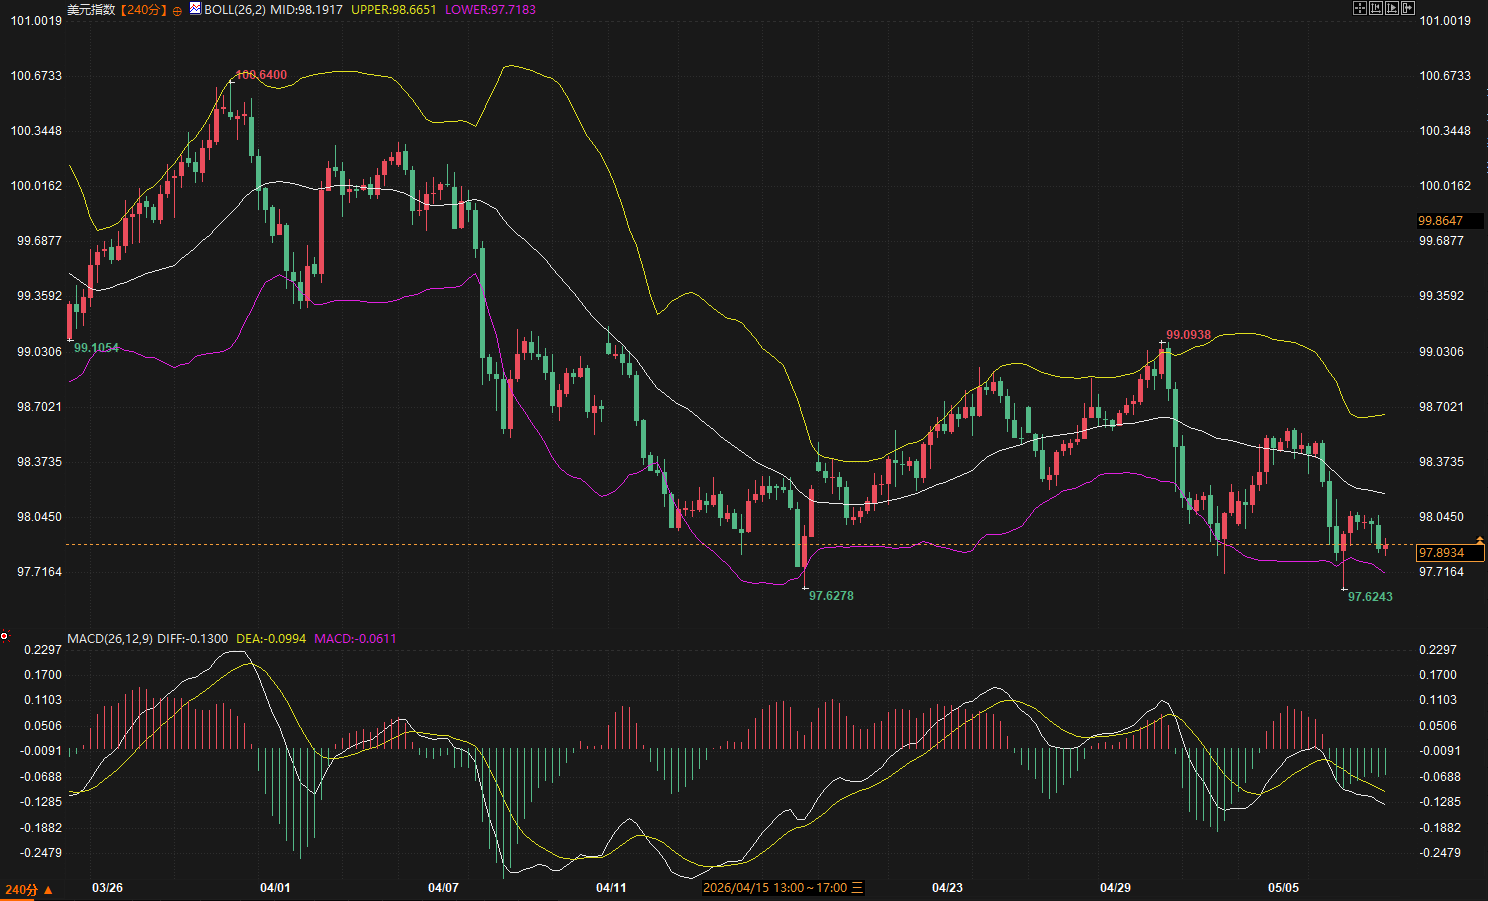
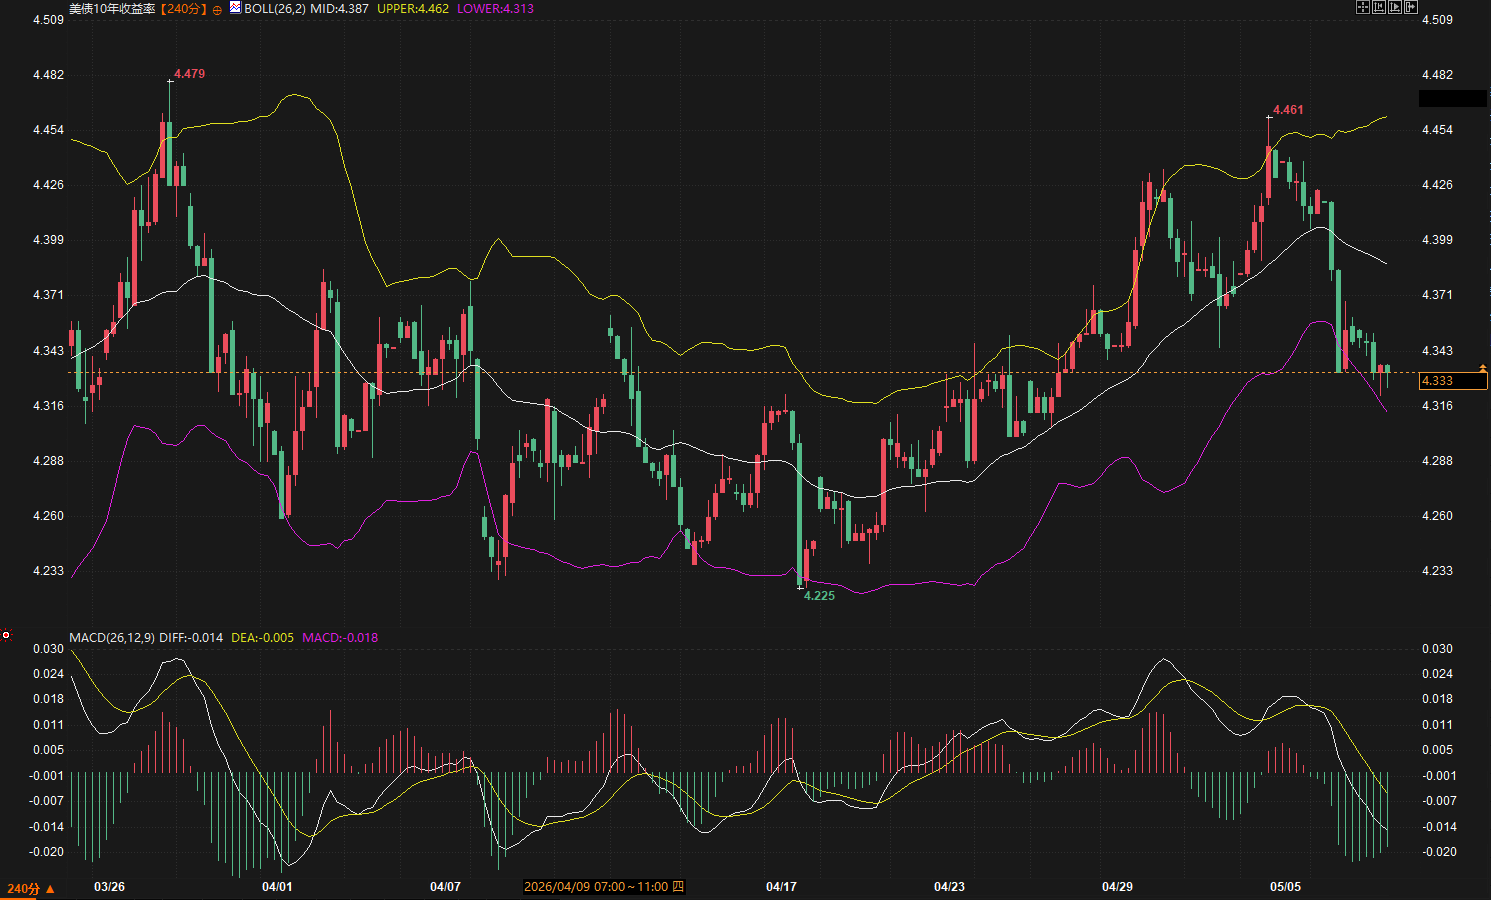
The US Dollar Index (DXY) is currently trading around 97.8934, with the 240-minute chart showing a weak trend. The Bollinger Bands are widening downwards, with the price moving along the lower band. The MACD histogram continues to expand, indicating significant bearish momentum. Meanwhile, the 10-year US Treasury yield has also fallen rapidly from its high of 4.461%, currently struggling around 4.333%. This "double whammy" reflects market expectations of a cooling US labor market.
The April non-farm payroll data, to be released on Friday, will be key to reversing or accelerating this trend. Analysts from prominent institutions believe that if the employment data is stronger than expected, the 10-year US Treasury yield is likely to stabilize around 4.30% ; conversely, if the data is weak, the yield may further decline to the 4.20%-4.25% range. Currently, under pressure from rising import costs due to tariff rhetoric and persistently high core inflation (3.2%), the Federal Reserve's decision-making space is severely limited.
Directly driven by the weakening US dollar and US Treasury yields, spot gold (XAU/USD) has recently performed exceptionally well. The 240-minute chart shows gold prices trading near the upper Bollinger Band at 4757.78, with the MACD histogram continuing to expand, indicating a clear bullish trend. This typical negative correlation suggests that, driven by both current inflation expectations and safe-haven demand, gold has become the preferred safe-haven asset.
From a technical perspective, gold prices currently face immediate resistance around 4753-4758 . A sustained break above this range would open up further upside potential, targeting the previous high of 4889. On the downside, the Bollinger Band middle line around 4620 forms a key support level in the short to medium term. Given current market concerns about continued supply shocks leading to normalized inflation, any pullback in gold prices appears more likely to be a technical consolidation than a trend reversal.

Looking ahead to the next 2-3 trading days, market movements will heavily depend on Friday's non-farm payroll report and the pace of Japanese authorities' intervention in the foreign exchange market. The Bank of Japan has already deployed over $32 billion to support the yen, which has to some extent curbed expectations of a stronger dollar.
Regarding crude oil, it is expected to remain in a high-level consolidation range of $88-$95 , with the marginal effect of the peace agreement diminishing unless there is a genuine resumption of physical loadings. The US dollar index will continue to test the previous low support level of 97.62 in the short term; a break below this level could trigger a new round of technical selling. Gold is in a "more likely to rise than fall" environment, possessing strong bullish momentum above the $4700 level. Investors should closely monitor the speeches of Federal Reserve officials tonight, as well as the secondary revision of inflation expectations based on labor cost data.
1. Why did crude oil prices not fall significantly despite positive news from the US-Iran negotiations?
This is due to market skepticism regarding a "paper peace." The risks to passage through the Strait of Hormuz have not yet been eliminated, and countries like the UAE even need to use covert navigation to transport crude oil. This actual transportation disruption keeps supply premiums high. Furthermore, low inventory levels in Europe and Asia provide structural support.
2. What is the specific impact path of the April non-farm payroll data on the US dollar?
Non-farm payroll data is a core indicator of the resilience of the US economy. Weak data would confirm speculation of a slowing labor market, pushing down US Treasury yields and further weakening the dollar's interest rate advantage. Conversely, strong data would trigger market expectations that the Federal Reserve will maintain high interest rates for a longer period, potentially giving the dollar a rebound momentum around 97.60.
3. Where are the current technical support and resistance levels for spot gold?
According to the 240-minute Bollinger Bands indicator, the key resistance zone for gold prices is currently around 4757.78. A breakout with significant volume could potentially challenge the historical high of 4889. The core support zone is located at 4620 (middle band) and 4500 (previous low). As long as the price doesn't fall below 4600, the bullish trend remains solid.
4. How do "tariff rhetoric" affect current monetary policy expectations?
Increased tariffs directly pushed up the cost of imported goods, causing the US core inflation rate to remain high at 3.2%, making it difficult to return to the 2% target range. This put the Federal Reserve in a dilemma: on the one hand, there are signs of an economic slowdown, and on the other hand, inflationary pressures require maintaining a tight monetary policy. This uncertainty has exacerbated the volatility of the US dollar index.
5. Does the Bank of Japan's intervention have an indirect impact on the commodity market?
Yes. The Bank of Japan's large-scale intervention by selling dollars and buying yen objectively put downward pressure on the dollar in the exchange rate market. Since most commodities (such as crude oil and gold) are priced in dollars, a weak dollar often indirectly supports the prices of these commodities, thereby pushing up the prices of dollar-denominated goods.
Crude oil market: A volatile pattern supported by structural premiums.
Even with expectations of a peace agreement circulating in the market, crude oil prices did not experience a precipitous drop, but instead demonstrated remarkable resilience. Behind this "seeking to fall but holding on" trend lies the long-term structural risks on the supply side. A well-known institution revealed that due to the potential threat from the Strait of Hormuz, some oil-producing countries, such as the UAE, have had to resort to extreme measures such as disabling location trackers when passing through the strait. This high risk premium has already been passed on to downstream refining and aviation industry costs.
From a technical perspective, crude oil is currently trading within a wide range of $83 to $100 . Global inventory reduction, particularly the shortages in European and Asian markets, provides solid support for oil prices. In the short term, the market's reaction to diplomatic efforts is muted, focusing more on structural uncertainties. If the situation in the Middle East fails to provide substantial guarantees for passage through the Straits of Hormuz, crude oil prices will remain high. Technical analysis suggests that a pullback to the $83-$84 range is expected to form strong support.
US Dollar and US Treasuries: Momentum Exhaustion Ahead of Non-Farm Payroll Data
The US Dollar Index (DXY) is currently trading around 97.8934, with the 240-minute chart showing a weak trend. The Bollinger Bands are widening downwards, with the price moving along the lower band. The MACD histogram continues to expand, indicating significant bearish momentum. Meanwhile, the 10-year US Treasury yield has also fallen rapidly from its high of 4.461%, currently struggling around 4.333%. This "double whammy" reflects market expectations of a cooling US labor market.
The April non-farm payroll data, to be released on Friday, will be key to reversing or accelerating this trend. Analysts from prominent institutions believe that if the employment data is stronger than expected, the 10-year US Treasury yield is likely to stabilize around 4.30% ; conversely, if the data is weak, the yield may further decline to the 4.20%-4.25% range. Currently, under pressure from rising import costs due to tariff rhetoric and persistently high core inflation (3.2%), the Federal Reserve's decision-making space is severely limited.
Spot gold: Bulls gather momentum to challenge resistance zone
Directly driven by the weakening US dollar and US Treasury yields, spot gold (XAU/USD) has recently performed exceptionally well. The 240-minute chart shows gold prices trading near the upper Bollinger Band at 4757.78, with the MACD histogram continuing to expand, indicating a clear bullish trend. This typical negative correlation suggests that, driven by both current inflation expectations and safe-haven demand, gold has become the preferred safe-haven asset.
From a technical perspective, gold prices currently face immediate resistance around 4753-4758 . A sustained break above this range would open up further upside potential, targeting the previous high of 4889. On the downside, the Bollinger Band middle line around 4620 forms a key support level in the short to medium term. Given current market concerns about continued supply shocks leading to normalized inflation, any pullback in gold prices appears more likely to be a technical consolidation than a trend reversal.
Future Outlook
Looking ahead to the next 2-3 trading days, market movements will heavily depend on Friday's non-farm payroll report and the pace of Japanese authorities' intervention in the foreign exchange market. The Bank of Japan has already deployed over $32 billion to support the yen, which has to some extent curbed expectations of a stronger dollar.
Regarding crude oil, it is expected to remain in a high-level consolidation range of $88-$95 , with the marginal effect of the peace agreement diminishing unless there is a genuine resumption of physical loadings. The US dollar index will continue to test the previous low support level of 97.62 in the short term; a break below this level could trigger a new round of technical selling. Gold is in a "more likely to rise than fall" environment, possessing strong bullish momentum above the $4700 level. Investors should closely monitor the speeches of Federal Reserve officials tonight, as well as the secondary revision of inflation expectations based on labor cost data.
Frequently Asked Questions
1. Why did crude oil prices not fall significantly despite positive news from the US-Iran negotiations?
This is due to market skepticism regarding a "paper peace." The risks to passage through the Strait of Hormuz have not yet been eliminated, and countries like the UAE even need to use covert navigation to transport crude oil. This actual transportation disruption keeps supply premiums high. Furthermore, low inventory levels in Europe and Asia provide structural support.
2. What is the specific impact path of the April non-farm payroll data on the US dollar?
Non-farm payroll data is a core indicator of the resilience of the US economy. Weak data would confirm speculation of a slowing labor market, pushing down US Treasury yields and further weakening the dollar's interest rate advantage. Conversely, strong data would trigger market expectations that the Federal Reserve will maintain high interest rates for a longer period, potentially giving the dollar a rebound momentum around 97.60.
3. Where are the current technical support and resistance levels for spot gold?
According to the 240-minute Bollinger Bands indicator, the key resistance zone for gold prices is currently around 4757.78. A breakout with significant volume could potentially challenge the historical high of 4889. The core support zone is located at 4620 (middle band) and 4500 (previous low). As long as the price doesn't fall below 4600, the bullish trend remains solid.
4. How do "tariff rhetoric" affect current monetary policy expectations?
Increased tariffs directly pushed up the cost of imported goods, causing the US core inflation rate to remain high at 3.2%, making it difficult to return to the 2% target range. This put the Federal Reserve in a dilemma: on the one hand, there are signs of an economic slowdown, and on the other hand, inflationary pressures require maintaining a tight monetary policy. This uncertainty has exacerbated the volatility of the US dollar index.
5. Does the Bank of Japan's intervention have an indirect impact on the commodity market?
Yes. The Bank of Japan's large-scale intervention by selling dollars and buying yen objectively put downward pressure on the dollar in the exchange rate market. Since most commodities (such as crude oil and gold) are priced in dollars, a weak dollar often indirectly supports the prices of these commodities, thereby pushing up the prices of dollar-denominated goods.
- Risk Warning and Disclaimer
- The market involves risk, and trading may not be suitable for all investors. This article is for reference only and does not constitute personal investment advice, nor does it take into account certain users’ specific investment objectives, financial situation, or other needs. Any investment decisions made based on this information are at your own risk.