The baton of short selling has been passed on! US Treasury bonds and the US dollar deliver a powerful "combination punch," putting pressure on gold's $4660 "moat."
2026-05-12 20:02:42
On Tuesday (May 12), the market presented a mixed picture of cautious recovery in risk appetite and risk aversion. Influenced by Middle East geopolitical factors, international oil prices rose significantly by over $3.50 to around $101.70, pushing the US Treasury yield curve slightly higher, with the 10-year Treasury yield rising to 4.434%. The US dollar index rebounded to around 98.24, while gold came under pressure and fell back to around 4704. Reports from major overseas institutions indicated that increased political uncertainty in the UK pushed local long-term bond yields to multi-year highs, weakening the pound, while the upcoming release of US CPI data increased market focus on the inflation path. Overall, the strengthening of the dollar and yields exerted some downward pressure on gold, leading to a slight increase in short-term cross-market volatility, but without breaking out of the main trading range.

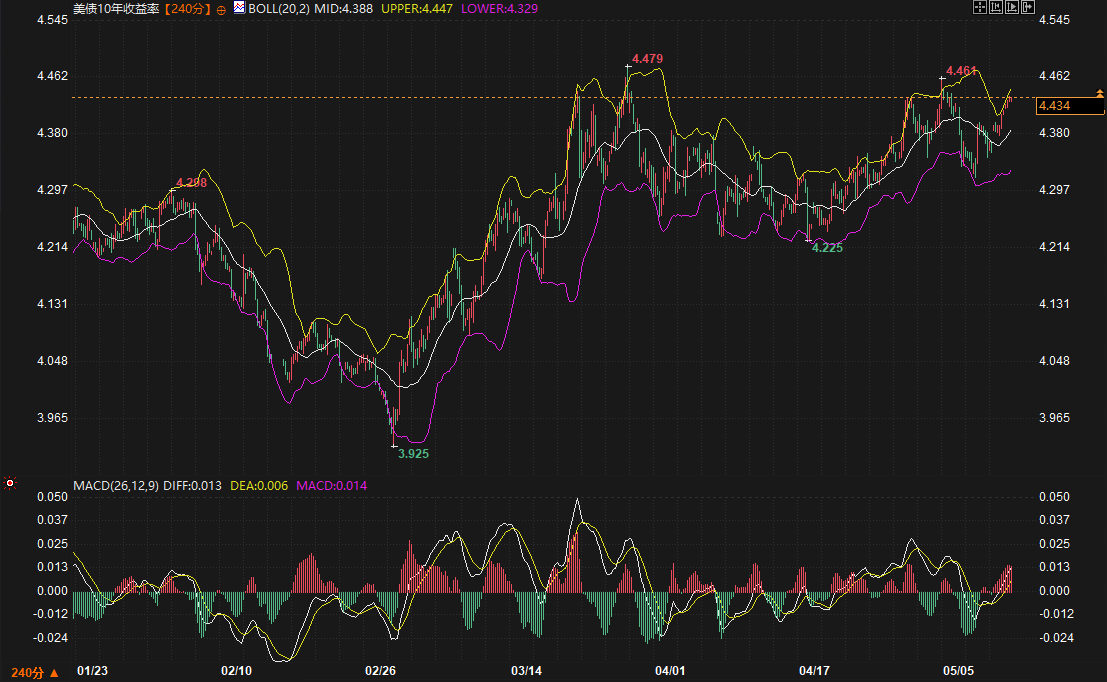
The 10-year US Treasury yield is currently at 4.434%, near the upper Bollinger Band on the 240-minute chart at 4.447, closely following the rebound high. The middle Bollinger Band at 4.388 provides short-term support, while the previous high of 4.479 in early April forms significant resistance. Technically, the price action after a one-sided upward move from the February low of 3.925 to a high of 4.225, followed by a rebound in May, indicates a consolidation phase after a period of range-bound trading.
The MACD indicator shows the DIFF line crossing above the DEA line to form a golden cross, with the histogram at 0.014 positive and continuously expanding, indicating strong short-term bullish momentum. On the fundamental front, rising oil prices and developments in the Middle East situation mentioned by major overseas institutions are supporting inflation expectations. Coupled with the spillover effects of uncertainty in the UK political situation, US Treasury yields face upward pressure. In the next 2-3 days, the yield will need to be monitored to see if it can effectively break through 4.479. If it holds, it may test higher levels; otherwise, it will likely remain volatile within the 4.388-4.447 range.
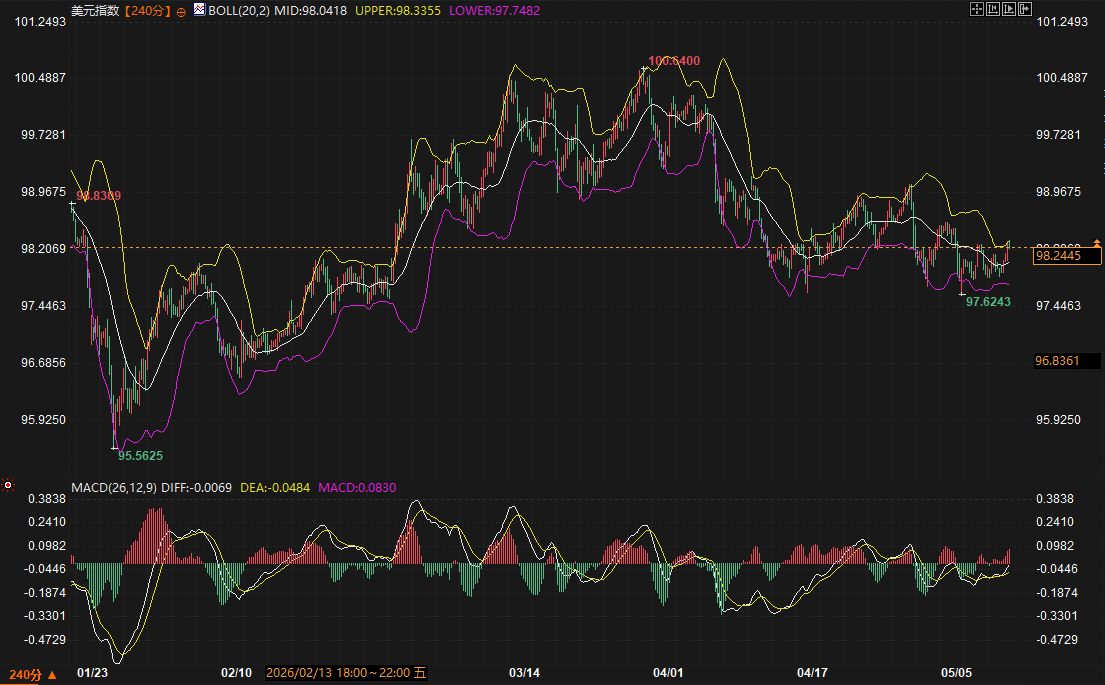
The US dollar index is currently at 98.2445, trading between the Bollinger Band middle line at 98.0418 and the upper line at 98.3355, exhibiting a low-level consolidation pattern. After previously rising from a low of 95.5625 to 100.6400 before falling back, the current middle line at 98.04 is acting as short-term support, while the upper line at 98.33 is acting as resistance.
The MACD histogram is positive and slightly expanding, with the DIFF line crossing above the DEA line in a golden cross, indicating short-term bullish dominance. Fundamentals are linked to US Treasury yields: rising oil prices are pushing up inflation expectations, coupled with the upcoming US CPI data, providing support for the US dollar. Reports from major overseas institutions also indicate that the US dollar is rebounding in line with risk sentiment fluctuations. In the short term, if the US dollar holds above the 98.04 mid-level, it may test the resistance near 98.90; conversely, the downside risk will point to the lower boundary area near 97.75.
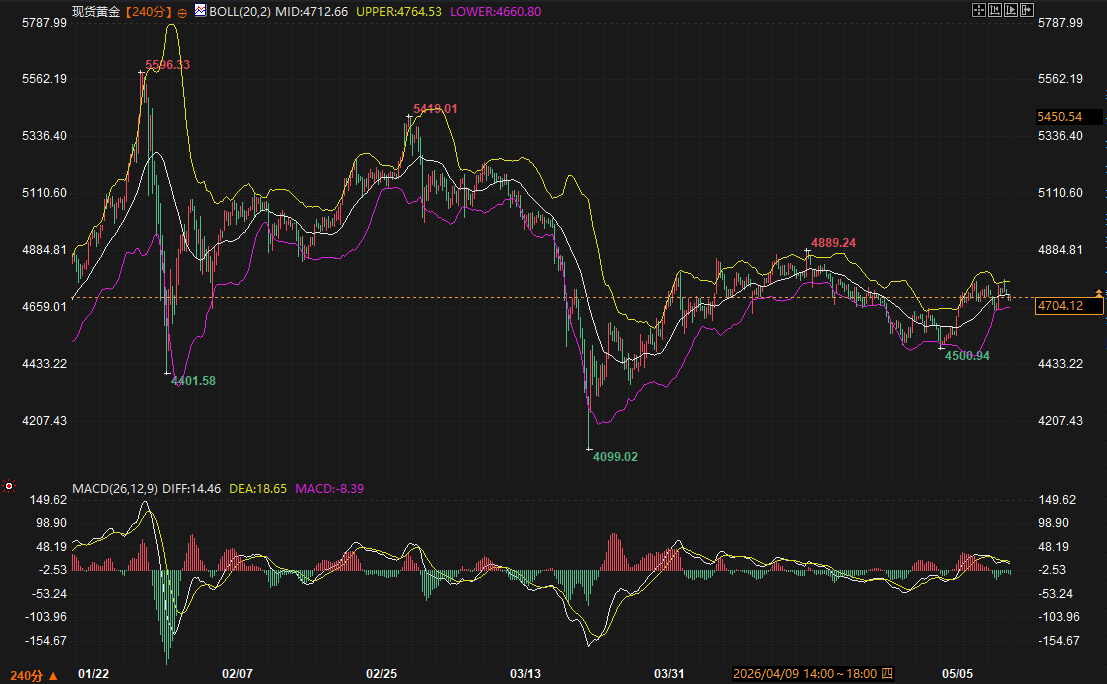
Spot gold is currently trading at 4704.12, hovering around the middle Bollinger Band at 4712.66, within the channel formed after the rebound from 4500.94 in late April. The lower Bollinger Band at 4660 provides strong short-term support, while the resistance level is the previous high of 4889.24. Overall, gold has entered a wide range of fluctuations after a significant drop from its historical high of 5596.33 to a low of 4099.02.
The MACD histogram is -8.39, which is negative but the absolute value is narrowing. The DIFF line is about to cross above the DEA line; if a golden cross forms, the rebound momentum is expected to strengthen. On the fundamental side, a stronger dollar and rising yields are putting downward pressure on gold prices. While rising oil prices are pushing up inflation, they are also raising expectations of real interest rates, which is bearish for gold in the short term. In the next 2-3 days, gold's price movement will be influenced by US CPI data and geopolitical news. If the 4660 support level holds, a rebound is expected; a break below could lead to further testing of lower levels.
Currently, US Treasury yields and the US dollar index are both trending upwards, forming the main downward pressure on gold. Rising oil prices and inflation data expectations are the core transmission pathways, and analysis from major overseas institutions shows that rising energy prices are influencing market pricing of Federal Reserve policies. Technically, all three are at key levels within the Bollinger Bands, with clear support/resistance ranges: yields 4.388-4.479, the US dollar 98.04-98.33, and gold 4660-4889. Short-term correlation is increasing. If yields break through 4.479 and help the US dollar stabilize above 98.33, downward pressure on gold will increase; conversely, if yields encounter resistance and fall back, the upside potential for gold may open up.
Considering both fundamentals and technicals, the market will likely remain data- and news-driven over the next 2-3 days. Following the release of the US CPI, if inflation data meets or exceeds expectations, yields and the US dollar may maintain a slightly stronger trend, while gold will continue to face pressure, but support around 4660 will hold. If the data is moderate, the correlation between these three factors may ease. Overall, the market is in a range-bound pattern. While gold's rebound momentum is accumulating, a break above the 4889 resistance level is needed to confirm a trend reversal. US Treasury yields and the US dollar show clearer short-term bullish signals, but both face resistance at previous highs. The market will remain cautiously balanced, with close attention paid to the latest developments in the Middle East and the impact of policy statements.
1. What is the current technical position of US Treasury yields, and what are the subsequent support and resistance levels?
The current yield is 4.434, closely following the upper Bollinger Band. The middle Bollinger Band at 4.388 provides short-term support, while 4.479 is a key resistance level. The MACD golden cross and expanding histogram indicate bullish momentum, but it's crucial to monitor whether it can effectively break through the highs; otherwise, it will likely remain in a high-level consolidation phase.
2. Why is gold currently under pressure, and where is the short-term support level?
A stronger US dollar and yields, coupled with the impact of oil prices, are putting downward pressure on the market. Technically, the price is trading near the middle Bollinger Band, with the lower band at 4660 acting as strong short-term support and 4889 as resistance. Although the MACD bearish momentum is weakening, a golden cross is still needed to confirm a rebound.
3. What factors dominate the short-term trend of the US dollar index?
The price is mainly influenced by oil prices, inflation data expectations, and yield curve. Currently, it is holding above the 98.04 mid-range level, and the MACD golden cross supports a slightly bullish trend. The upper band at 98.33 is the resistance level; a break above this level could lead to a test of 98.90.
4. What potential impact will the US CPI data have on the three markets?
If the data exceeds expectations, it will intensify inflation concerns, pushing up yields and the US dollar, thereby suppressing gold prices; moderate data may alleviate the pressure. All three are at key technical levels, and the data results may trigger amplified short-term volatility.
5. What is the core logic for cross-market trends in the next 2-3 days?
The main theme is the correlation between yields and the US dollar, with gold indirectly affected. Technical support and resistance levels are clear, while fundamental factors focus on data releases and geopolitical news. Overall, the market is expected to remain range-bound; watch for breakout signals to determine whether the trend will continue or reverse.
US Treasury Yields: Bullish Momentum Amid High-Level Fluctuations
The 10-year US Treasury yield is currently at 4.434%, near the upper Bollinger Band on the 240-minute chart at 4.447, closely following the rebound high. The middle Bollinger Band at 4.388 provides short-term support, while the previous high of 4.479 in early April forms significant resistance. Technically, the price action after a one-sided upward move from the February low of 3.925 to a high of 4.225, followed by a rebound in May, indicates a consolidation phase after a period of range-bound trading.
The MACD indicator shows the DIFF line crossing above the DEA line to form a golden cross, with the histogram at 0.014 positive and continuously expanding, indicating strong short-term bullish momentum. On the fundamental front, rising oil prices and developments in the Middle East situation mentioned by major overseas institutions are supporting inflation expectations. Coupled with the spillover effects of uncertainty in the UK political situation, US Treasury yields face upward pressure. In the next 2-3 days, the yield will need to be monitored to see if it can effectively break through 4.479. If it holds, it may test higher levels; otherwise, it will likely remain volatile within the 4.388-4.447 range.
US Dollar Index: Slightly bullish with fluctuations; watch for support at the middle Bollinger Band.
The US dollar index is currently at 98.2445, trading between the Bollinger Band middle line at 98.0418 and the upper line at 98.3355, exhibiting a low-level consolidation pattern. After previously rising from a low of 95.5625 to 100.6400 before falling back, the current middle line at 98.04 is acting as short-term support, while the upper line at 98.33 is acting as resistance.
The MACD histogram is positive and slightly expanding, with the DIFF line crossing above the DEA line in a golden cross, indicating short-term bullish dominance. Fundamentals are linked to US Treasury yields: rising oil prices are pushing up inflation expectations, coupled with the upcoming US CPI data, providing support for the US dollar. Reports from major overseas institutions also indicate that the US dollar is rebounding in line with risk sentiment fluctuations. In the short term, if the US dollar holds above the 98.04 mid-level, it may test the resistance near 98.90; conversely, the downside risk will point to the lower boundary area near 97.75.
Gold: Rebound channel faces resistance; watch for lower support level.
Spot gold is currently trading at 4704.12, hovering around the middle Bollinger Band at 4712.66, within the channel formed after the rebound from 4500.94 in late April. The lower Bollinger Band at 4660 provides strong short-term support, while the resistance level is the previous high of 4889.24. Overall, gold has entered a wide range of fluctuations after a significant drop from its historical high of 5596.33 to a low of 4099.02.
The MACD histogram is -8.39, which is negative but the absolute value is narrowing. The DIFF line is about to cross above the DEA line; if a golden cross forms, the rebound momentum is expected to strengthen. On the fundamental side, a stronger dollar and rising yields are putting downward pressure on gold prices. While rising oil prices are pushing up inflation, they are also raising expectations of real interest rates, which is bearish for gold in the short term. In the next 2-3 days, gold's price movement will be influenced by US CPI data and geopolitical news. If the 4660 support level holds, a rebound is expected; a break below could lead to further testing of lower levels.
Cross-market linkage: The impact of yield and dollar resonance on gold
Currently, US Treasury yields and the US dollar index are both trending upwards, forming the main downward pressure on gold. Rising oil prices and inflation data expectations are the core transmission pathways, and analysis from major overseas institutions shows that rising energy prices are influencing market pricing of Federal Reserve policies. Technically, all three are at key levels within the Bollinger Bands, with clear support/resistance ranges: yields 4.388-4.479, the US dollar 98.04-98.33, and gold 4660-4889. Short-term correlation is increasing. If yields break through 4.479 and help the US dollar stabilize above 98.33, downward pressure on gold will increase; conversely, if yields encounter resistance and fall back, the upside potential for gold may open up.
Trend Outlook
Considering both fundamentals and technicals, the market will likely remain data- and news-driven over the next 2-3 days. Following the release of the US CPI, if inflation data meets or exceeds expectations, yields and the US dollar may maintain a slightly stronger trend, while gold will continue to face pressure, but support around 4660 will hold. If the data is moderate, the correlation between these three factors may ease. Overall, the market is in a range-bound pattern. While gold's rebound momentum is accumulating, a break above the 4889 resistance level is needed to confirm a trend reversal. US Treasury yields and the US dollar show clearer short-term bullish signals, but both face resistance at previous highs. The market will remain cautiously balanced, with close attention paid to the latest developments in the Middle East and the impact of policy statements.
Frequently Asked Questions
1. What is the current technical position of US Treasury yields, and what are the subsequent support and resistance levels?
The current yield is 4.434, closely following the upper Bollinger Band. The middle Bollinger Band at 4.388 provides short-term support, while 4.479 is a key resistance level. The MACD golden cross and expanding histogram indicate bullish momentum, but it's crucial to monitor whether it can effectively break through the highs; otherwise, it will likely remain in a high-level consolidation phase.
2. Why is gold currently under pressure, and where is the short-term support level?
A stronger US dollar and yields, coupled with the impact of oil prices, are putting downward pressure on the market. Technically, the price is trading near the middle Bollinger Band, with the lower band at 4660 acting as strong short-term support and 4889 as resistance. Although the MACD bearish momentum is weakening, a golden cross is still needed to confirm a rebound.
3. What factors dominate the short-term trend of the US dollar index?
The price is mainly influenced by oil prices, inflation data expectations, and yield curve. Currently, it is holding above the 98.04 mid-range level, and the MACD golden cross supports a slightly bullish trend. The upper band at 98.33 is the resistance level; a break above this level could lead to a test of 98.90.
4. What potential impact will the US CPI data have on the three markets?
If the data exceeds expectations, it will intensify inflation concerns, pushing up yields and the US dollar, thereby suppressing gold prices; moderate data may alleviate the pressure. All three are at key technical levels, and the data results may trigger amplified short-term volatility.
5. What is the core logic for cross-market trends in the next 2-3 days?
The main theme is the correlation between yields and the US dollar, with gold indirectly affected. Technical support and resistance levels are clear, while fundamental factors focus on data releases and geopolitical news. Overall, the market is expected to remain range-bound; watch for breakout signals to determine whether the trend will continue or reverse.
- Risk Warning and Disclaimer
- The market involves risk, and trading may not be suitable for all investors. This article is for reference only and does not constitute personal investment advice, nor does it take into account certain users’ specific investment objectives, financial situation, or other needs. Any investment decisions made based on this information are at your own risk.