Gold tests the $4,700 level: With inflation returning, how much bullish momentum remains?
2026-05-12 21:59:26
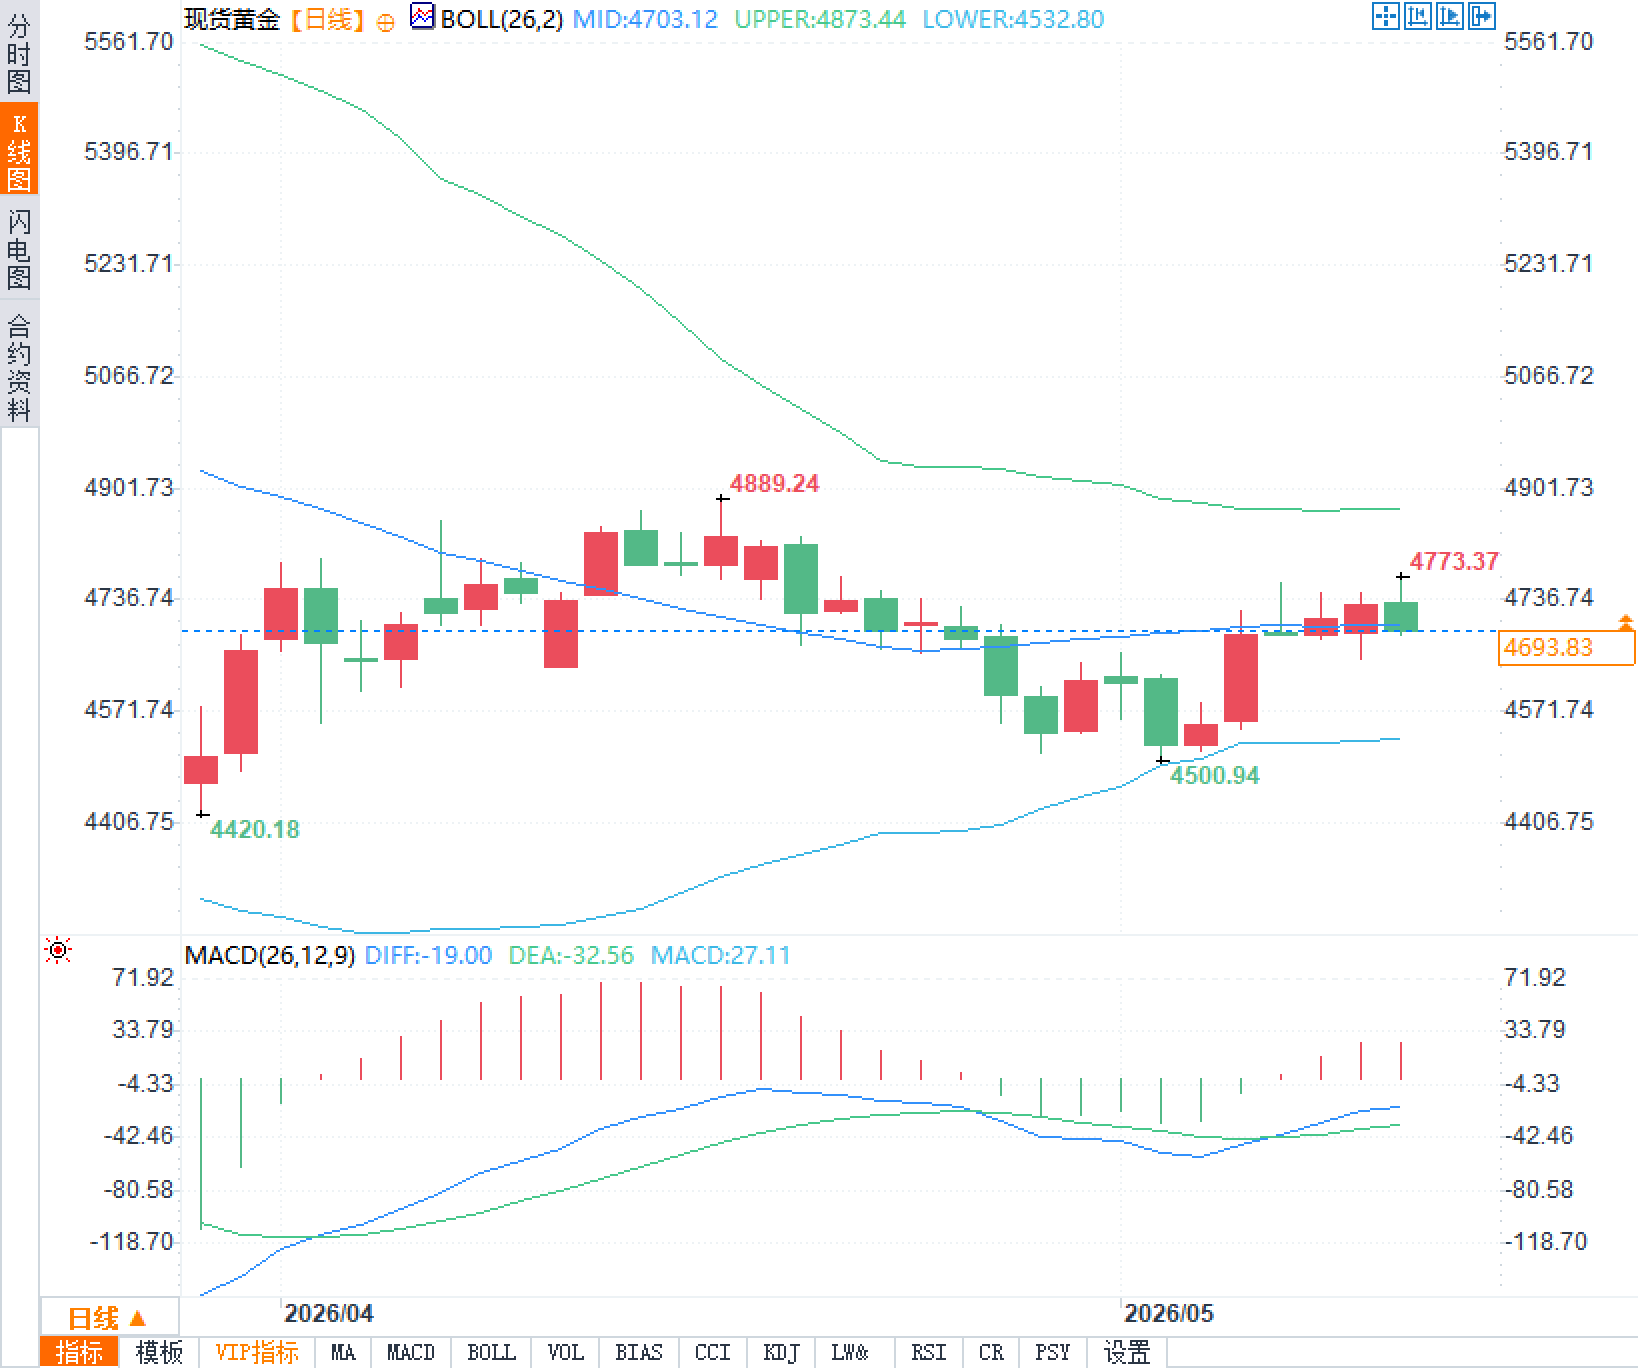
On Tuesday, May 12th, spot gold prices traded around $4700 per ounce during the North American session. After reaching a high of $4773.37 per ounce, it retreated to around $4693.83 per ounce. The Bollinger Band middle line was at $4703.12 per ounce, the upper line at $4873.44 per ounce, and the lower line at $4532.80 per ounce. On the same day, a senior official of the Iranian Revolutionary Guard Navy announced a significant expansion of the operational area definition in the Strait of Hormuz. Meanwhile, the US April Consumer Price Index rose to 3.8% year-on-year, exceeding market expectations. Coupled with the stalemate in US-Iran negotiations, market risk aversion and a strong dollar created a clear tug-of-war, putting short-term pressure on gold, but geopolitical risk premiums provided support.
Mohammad Akbarzadeh, deputy political director of the Iranian Revolutionary Guard Navy, explicitly stated that the Strait of Hormuz is no longer confined to the narrow waters surrounding a few islands, but has expanded into a vast strategic area stretching from Jask in the east to Siri in the west. Its width has increased dramatically from the previously estimated 32-48 kilometers to 322-483 kilometers, forming a complete crescent-shaped operational zone. This adjustment marks the second time since the outbreak of the conflict that Iran has publicly expanded its control, directly covering approximately one-fifth of the world's oil and liquefied natural gas transport routes, with major exporters including Saudi Arabia, Iraq, and Qatar.
The expansion of this region directly boosted the risk premium for crude oil. Oil prices rose more than 3% that day, with Brent crude remaining at high levels. HSBC last week raised its 2026 average Brent crude price forecast to $95 per barrel, with the baseline scenario assuming that Straits traffic gradually recovers by mid-June and approaches normal levels by the end of the third quarter. If negotiations are delayed until late summer, the average price in 2026 could rise to $110 per barrel; in a pessimistic scenario where a comprehensive agreement takes about six months, the average price in 2026 could reach $120 per barrel. High energy prices indirectly support gold as a hedge against uncertainty through cost transmission and inflation expectations, but also reinforce the market's cautious assessment of the Federal Reserve's policy path.
Data from the U.S. Bureau of Labor Statistics shows that the Consumer Price Index (CPI) rose 0.6% month-over-month in April, and the year-over-year increase widened to 3.8%, the fastest pace in nearly three years, exceeding market expectations of 3.7%. The core CPI rose 0.4% month-over-month and 2.8% year-over-year, also exceeding expectations of 0.3% and 2.7%, respectively. Rising energy prices were a major driving factor, directly related to the geopolitical situation in the Middle East.
The following is a comparison of key data.
Accelerating inflation has strengthened market expectations that the Federal Reserve will maintain high interest rates for a longer period. The CME FedWatch tool shows that traders believe there is a high probability the Fed will keep interest rates unchanged this year, with a roughly 36% probability of a rate hike at the December meeting. A stronger US dollar index is putting temporary pressure on gold, a non-interest-bearing asset, but persistently high energy costs also provide gold with a medium- to long-term inflation hedge.
From the daily chart, spot gold is fluctuating around the middle Bollinger Band at $4703.12/oz. The upper band at $4873.44/oz provides short-term resistance, while the lower band at $4532.80/oz offers support. The recent pullback from the high of $4889.24/oz indicates weakening bullish momentum, but geopolitical risks continue to limit downside. The MACD indicator shows a DIFF value of -19.00, a DEA value of -32.56, and a MACD histogram reading of 27.11, suggesting continued short-term consolidation. Attention should be paid to whether the price can hold above the middle Bollinger Band.
Energy shocks from escalating tensions in the Strait of Hormuz
Mohammad Akbarzadeh, deputy political director of the Iranian Revolutionary Guard Navy, explicitly stated that the Strait of Hormuz is no longer confined to the narrow waters surrounding a few islands, but has expanded into a vast strategic area stretching from Jask in the east to Siri in the west. Its width has increased dramatically from the previously estimated 32-48 kilometers to 322-483 kilometers, forming a complete crescent-shaped operational zone. This adjustment marks the second time since the outbreak of the conflict that Iran has publicly expanded its control, directly covering approximately one-fifth of the world's oil and liquefied natural gas transport routes, with major exporters including Saudi Arabia, Iraq, and Qatar.
The expansion of this region directly boosted the risk premium for crude oil. Oil prices rose more than 3% that day, with Brent crude remaining at high levels. HSBC last week raised its 2026 average Brent crude price forecast to $95 per barrel, with the baseline scenario assuming that Straits traffic gradually recovers by mid-June and approaches normal levels by the end of the third quarter. If negotiations are delayed until late summer, the average price in 2026 could rise to $110 per barrel; in a pessimistic scenario where a comprehensive agreement takes about six months, the average price in 2026 could reach $120 per barrel. High energy prices indirectly support gold as a hedge against uncertainty through cost transmission and inflation expectations, but also reinforce the market's cautious assessment of the Federal Reserve's policy path.
US April inflation data and Federal Reserve interest rate expectations
Data from the U.S. Bureau of Labor Statistics shows that the Consumer Price Index (CPI) rose 0.6% month-over-month in April, and the year-over-year increase widened to 3.8%, the fastest pace in nearly three years, exceeding market expectations of 3.7%. The core CPI rose 0.4% month-over-month and 2.8% year-over-year, also exceeding expectations of 0.3% and 2.7%, respectively. Rising energy prices were a major driving factor, directly related to the geopolitical situation in the Middle East.
The following is a comparison of key data.
| index | April month-on-month | Year-on-year | Market expectations | Previous value |
|---|---|---|---|---|
| Consumer Price Index | 0.6% | 3.8% | 3.7% | 3.3% |
| Core Consumer Price Index | 0.4% | 2.8% | 2.7% | 2.6% |
Technical Analysis and Market Relationship of Spot Gold
From the daily chart, spot gold is fluctuating around the middle Bollinger Band at $4703.12/oz. The upper band at $4873.44/oz provides short-term resistance, while the lower band at $4532.80/oz offers support. The recent pullback from the high of $4889.24/oz indicates weakening bullish momentum, but geopolitical risks continue to limit downside. The MACD indicator shows a DIFF value of -19.00, a DEA value of -32.56, and a MACD histogram reading of 27.11, suggesting continued short-term consolidation. Attention should be paid to whether the price can hold above the middle Bollinger Band.
Frequently Asked Questions
Question 1: What direct impact does Iran's expansion of the definition of the Strait of Hormuz have on the pricing logic of spot gold?
A: This adjustment significantly increases the risk premium for oil supply disruptions, pushing up crude oil prices and reinforcing global inflation expectations through cost channels. Gold, as a traditional safe-haven asset, receives support during periods of heightened geopolitical uncertainty, but simultaneously faces temporary pressure from a stronger US dollar due to high inflation; these two factors create a dynamic interplay. Current prices are fluctuating around the midpoint of $4700/ounce, indicating that the market is weighing the relative strength of the risk premium against interest rate expectations.
Question 2: How will the better-than-expected US inflation data in April affect the Fed's policy path and gold?
A: The month-on-month inflation readings of 0.6% and year-on-year inflation of 3.8% indicate continued price pressures, fueling market expectations that the Federal Reserve will maintain high interest rates for a longer period. This has supported the US dollar and suppressed gold prices. High energy prices are a significant driver, forming a closed loop with the situation in the Middle East. Traders are primarily focused on whether subsequent data will continue this trend and whether the Federal Reserve will consider adjusting its interest rate path before the end of the year.
Question 3: How do the technical and fundamental factors of spot gold resonate at present, and what signals should traders pay close attention to?
A: The Bollinger Band middle line at $4703/oz is a key watershed, with resistance at $4873/oz and support at $4532/oz. The MACD indicator shows a short-term consolidation pattern. On the fundamental front, the progress of traffic recovery in the Strait of Hormuz, the progress of US-Iran negotiations, and next month's inflation data will be key catalysts. The balance between risk premium and interest rate expectations will determine the direction of gold's breakout.
- Risk Warning and Disclaimer
- The market involves risk, and trading may not be suitable for all investors. This article is for reference only and does not constitute personal investment advice, nor does it take into account certain users’ specific investment objectives, financial situation, or other needs. Any investment decisions made based on this information are at your own risk.