The battle for gold at the $4700 mark is in full swing! How long can the bulls' last line of defense hold?
2026-05-13 21:59:30
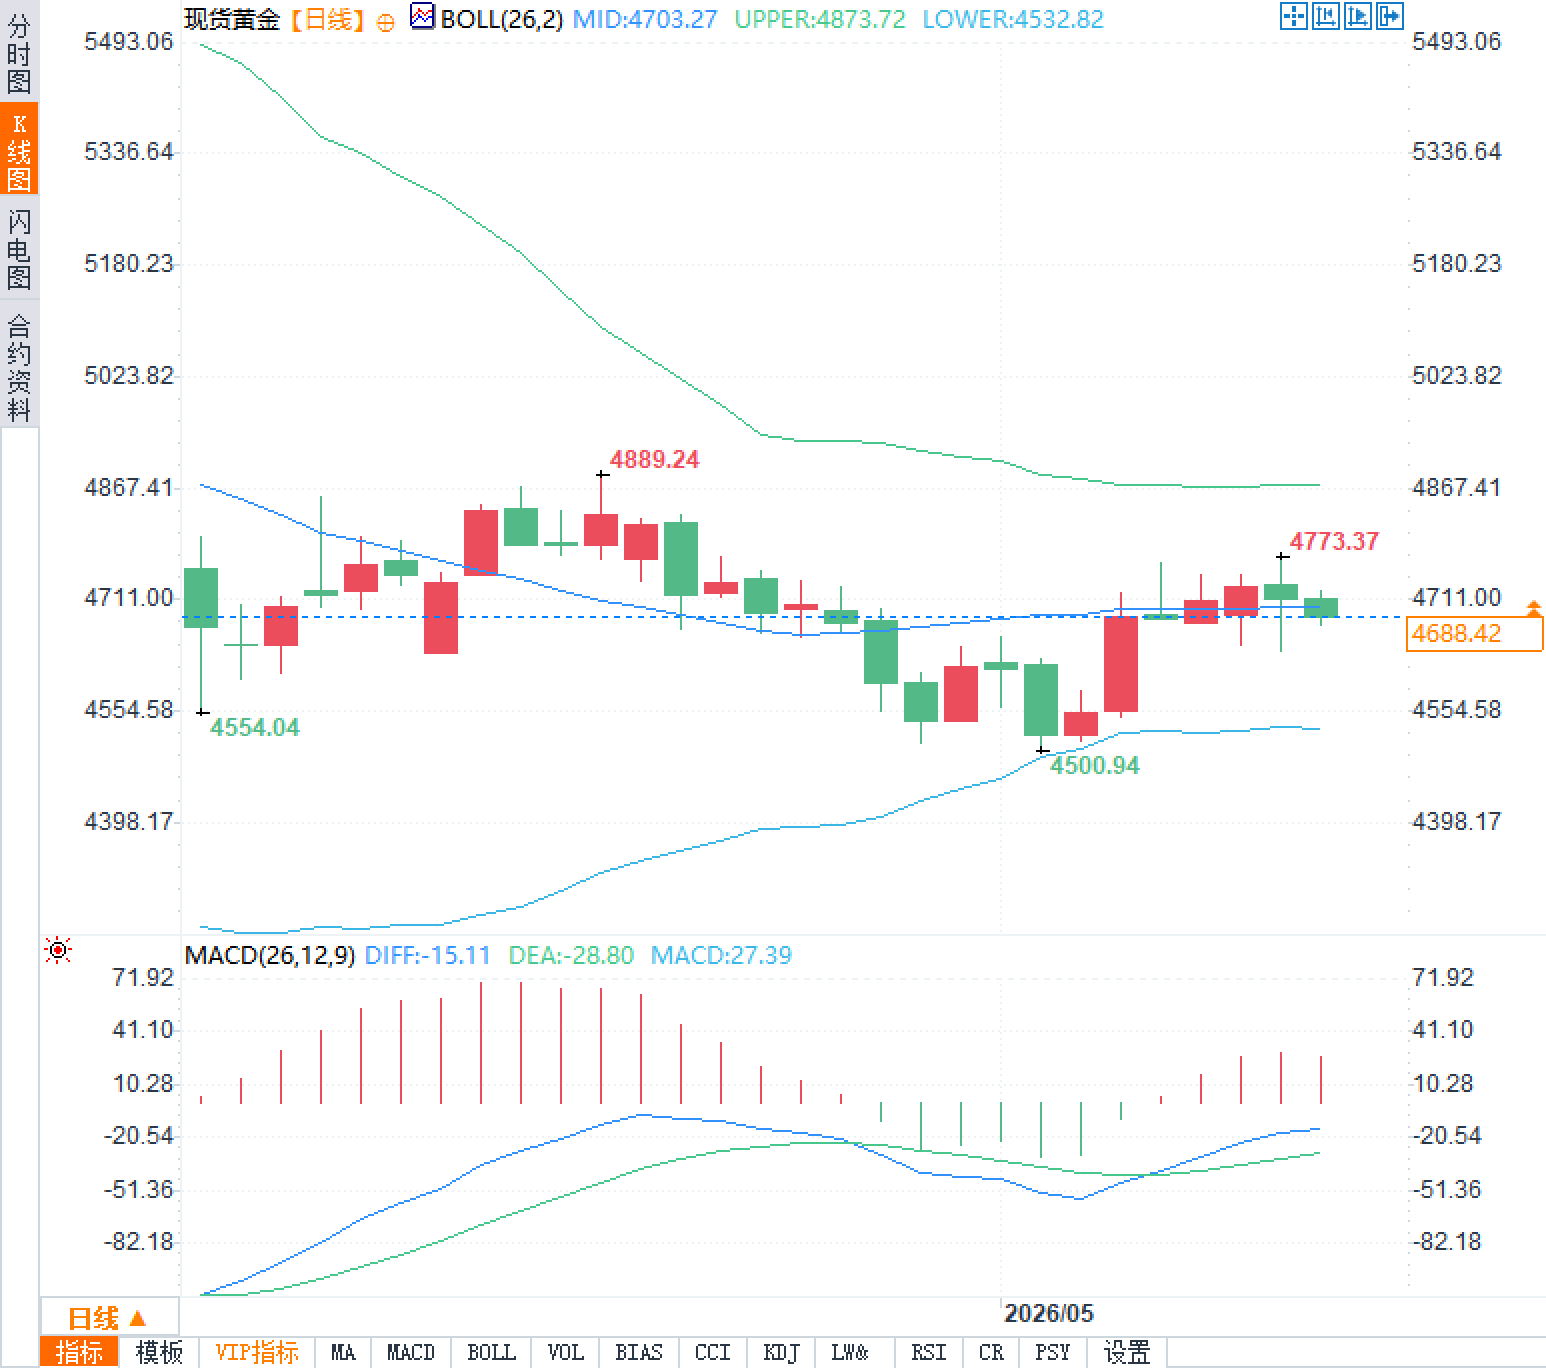
On Wednesday, May 13th, spot gold traded below $4700 during the North American session, down approximately 0.75% on the day. This movement occurred against a complex backdrop of a slight rebound in the US dollar index to around 98.5, crude oil prices remaining above $100, renewed uncertainty in the Middle East, and stronger-than-expected US April inflation data. Traders are closely watching the continued transmission of energy supply chain disruptions to prices and potential adjustments to the Federal Reserve's policy path. The latest candlestick chart shows spot gold oscillating around the Bollinger Band middle line at 4703.27, with the upper band at 4873.72 and the lower band at 4532.82 forming a clear channel. The recent high of 4889.24 was followed by a pullback, indicating some technical pressure.
The Middle East conflict has effectively blocked the Strait of Hormuz, disrupting oil supply and directly driving up global energy costs. WTI crude oil prices have remained firmly above $100, while Brent crude is approaching $107, with the surge in energy prices quickly translating into higher consumer prices. The US Consumer Price Index (CPI) rose 3.8% year-on-year in April, a new high since May 2023, far exceeding market expectations of 3.7% and the previous month's 3.3%. The energy component saw a year-on-year increase of 17.9%, with gasoline prices rising 28.4% and fuel oil prices soaring 54.3%. The Producer Price Index (PPI) was equally robust, rising 6% year-on-year in April and 1.4% month-on-month, with core PPI rising 5.2% year-on-year, both reaching recent highs.
This inflationary pressure is not a short-term phenomenon. Supply chain recovery will take time, and persistently high transportation and logistics costs will continue to support prices. The structural rise in energy prices is changing expectations of the persistence of inflation.
Better-than-expected inflation data directly weakened market confidence in a Federal Reserve rate cut this year. According to the CME FedWatch tool, traders now expect the Fed to keep rates unchanged in the short term, with the probability of a 25 basis point rate hike in December rising to about 33%, and the probability of a rate hike in January 2027 approaching 41.5%. The yield on the 10-year US Treasury note climbed to 4.48%, its highest level since July 2025. Rising real interest rates further reduce the attractiveness of non-interest-bearing assets, temporarily weakening spot gold's role as a traditional inflation hedge. The strengthening of the US dollar index to 98.5, a new high since May 5th, also directly pressured gold prices.
From the daily chart, spot gold has recently retreated from a high of $4889.24 and is currently fluctuating narrowly around $4700. The Bollinger Bands are gradually narrowing, suggesting that short-term volatility may increase. After repeatedly testing the middle Bollinger Band at $4703.27, the price has experienced a slight pullback, and the $4700 psychological level has become the current focus of contention between bulls and bears.
On the demand side, India, a major global gold consumer, suddenly and drastically increased import tariffs on gold and silver from 6% to 15%. This move has already caused a sharp rise in domestic gold prices in India and may suppress physical demand in the coming months. Global physical buying is facing a temporary cooling, while the high-interest-rate environment further reduces the willingness to hold speculative positions. These combined factors make it difficult for gold to escape its downward pressure in the short term.
Geopolitical risks continue to push up energy prices and inflationary pressures.
The Middle East conflict has effectively blocked the Strait of Hormuz, disrupting oil supply and directly driving up global energy costs. WTI crude oil prices have remained firmly above $100, while Brent crude is approaching $107, with the surge in energy prices quickly translating into higher consumer prices. The US Consumer Price Index (CPI) rose 3.8% year-on-year in April, a new high since May 2023, far exceeding market expectations of 3.7% and the previous month's 3.3%. The energy component saw a year-on-year increase of 17.9%, with gasoline prices rising 28.4% and fuel oil prices soaring 54.3%. The Producer Price Index (PPI) was equally robust, rising 6% year-on-year in April and 1.4% month-on-month, with core PPI rising 5.2% year-on-year, both reaching recent highs.
| index | April data | Market expectations | March value |
|---|---|---|---|
| CPI year-on-year | 3.8% | 3.7% | 3.3% |
| PPI year-on-year | 6% | — | — |
| Year-on-year comparison of energy sub-item | 17.9% | — | 12.5% |
This inflationary pressure is not a short-term phenomenon. Supply chain recovery will take time, and persistently high transportation and logistics costs will continue to support prices. The structural rise in energy prices is changing expectations of the persistence of inflation.
The Federal Reserve's policy path faces expectations of higher interest rates.
Better-than-expected inflation data directly weakened market confidence in a Federal Reserve rate cut this year. According to the CME FedWatch tool, traders now expect the Fed to keep rates unchanged in the short term, with the probability of a 25 basis point rate hike in December rising to about 33%, and the probability of a rate hike in January 2027 approaching 41.5%. The yield on the 10-year US Treasury note climbed to 4.48%, its highest level since July 2025. Rising real interest rates further reduce the attractiveness of non-interest-bearing assets, temporarily weakening spot gold's role as a traditional inflation hedge. The strengthening of the US dollar index to 98.5, a new high since May 5th, also directly pressured gold prices.
Spot gold is caught in a dual battle between technical and demand factors.
From the daily chart, spot gold has recently retreated from a high of $4889.24 and is currently fluctuating narrowly around $4700. The Bollinger Bands are gradually narrowing, suggesting that short-term volatility may increase. After repeatedly testing the middle Bollinger Band at $4703.27, the price has experienced a slight pullback, and the $4700 psychological level has become the current focus of contention between bulls and bears.
On the demand side, India, a major global gold consumer, suddenly and drastically increased import tariffs on gold and silver from 6% to 15%. This move has already caused a sharp rise in domestic gold prices in India and may suppress physical demand in the coming months. Global physical buying is facing a temporary cooling, while the high-interest-rate environment further reduces the willingness to hold speculative positions. These combined factors make it difficult for gold to escape its downward pressure in the short term.
Frequently Asked Questions
Question 1: What are the core factors that are currently causing the main downward pressure on spot gold?
A: The main pressures stem from the strengthening of the US dollar index to around 98.5, the rise in US Treasury yields to a high of 4.48%, and the strengthening of expectations that the Federal Reserve will maintain high interest rates or even raise them. The Middle East conflict has pushed up oil prices and inflation, but in a high-interest-rate environment, it has weakened gold's safe-haven and inflation-hedging attributes. India's tariff increase to 15% has further suppressed physical demand, creating a double whammy from both the macro and demand sides.
Question 2: How will the impact of geopolitical conflicts on the safe-haven properties of spot gold evolve?
A: The conflict led to the closure of the Strait of Hormuz, keeping oil prices above $100 and contributing to inflation. However, the high-interest-rate policy path reduced the attractiveness of gold. In the short term, the energy shock boosted inflation expectations, but this was offset by a strong dollar and rising yields, making it difficult for gold to play its traditional safe-haven role, resulting in a situation where the negative factors outweighed the positive ones.
Question 3: What long-term impact will India's increase in gold import tariffs have on the global market?
A: As a major consumer, the increase in tariffs from 6% to 15% will directly suppress physical demand in India, leading to a surge in domestic gold prices, but also potentially increasing global supply pressure. Traders need to pay attention to subsequent demand data changes, as this could become a crucial variable in the supply and demand balance of the gold market in 2026.
- Risk Warning and Disclaimer
- The market involves risk, and trading may not be suitable for all investors. This article is for reference only and does not constitute personal investment advice, nor does it take into account certain users’ specific investment objectives, financial situation, or other needs. Any investment decisions made based on this information are at your own risk.