The $4,480 "gravity test": Does gold want to skydive or bungee jump?
2026-05-18 18:21:56
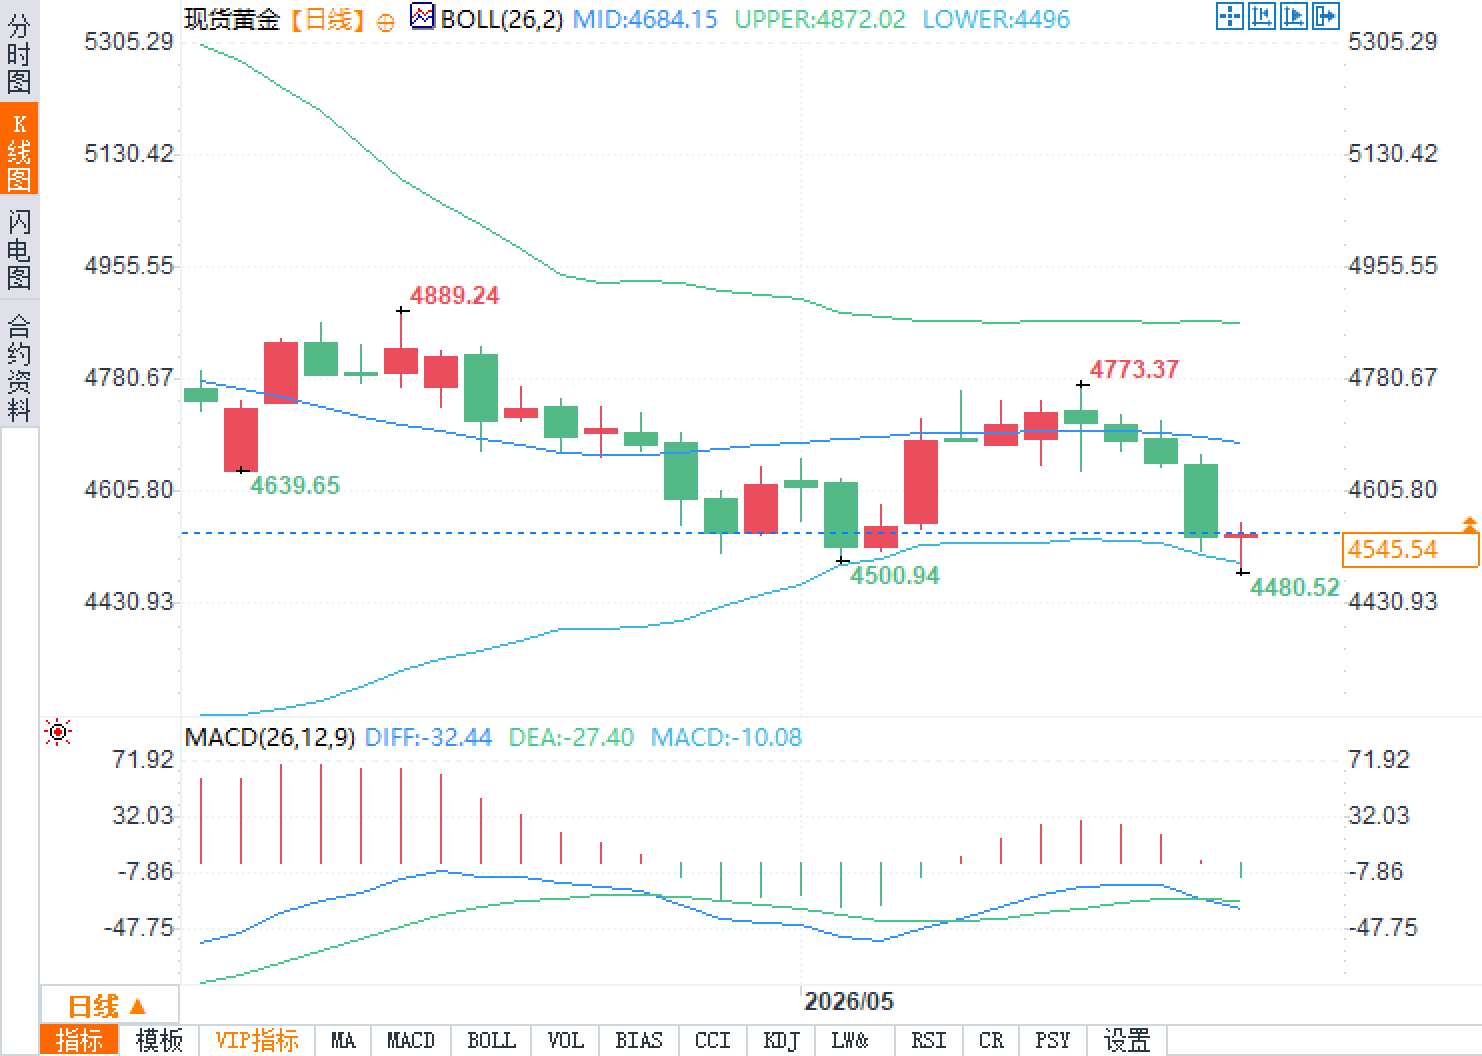
On Monday, May 18th, spot gold fluctuated around $4545 per ounce, a significant pullback from previous highs, briefly approaching the $4480 per ounce area. The daily chart shows that gold prices have broken below the Bollinger Band middle line at $4684.15, with the price near the lower band at $4496. The MACD remains below the zero line, indicating a shift in the short-term structure from "high-level consolidation" to "weak recovery."
Fundamentally, gold prices are not lacking in safe-haven appeal, but are instead suppressed by rising real interest rates, inflation repricing due to rising energy prices, and expectations of renewed tightening of Federal Reserve policy. While gold is showing signs of stabilizing, high interest rate expectations continue to limit upside potential.
The key contradiction in this round of spot gold price decline lies in the shift of market pricing focus from "geopolitical risk premium" to "real interest rate penalty." Typically, geopolitical conflicts, shipping disruptions, and energy supply uncertainties increase the safe-haven demand for gold. However, when rising oil prices are interpreted by the market as double-dip inflationary pressure, gold's positive safe-haven attribute is partially offset by higher real interest rates.
In other words, traders are currently not focused on "whether the risk exists," but rather on "whether the risk will ultimately force the Federal Reserve to maintain high interest rates for longer, or even release more hawkish rhetoric." The yield on the 10-year Treasury Inflation-Protected Securities (TIPS) rose to approximately 2.10% on May 18, an increase of about 0.21 percentage points over the past month, indicating that rising risk-free real returns are weakening the relative attractiveness of non-interest-bearing assets.
From a technical perspective, spot gold formed a high near $4889.24, then rebounded to a lower high of $4773.37 before falling back to around $4480.52. After breaking below the middle Bollinger Band, the lower Bollinger Band became the first resistance test zone for short-term fluctuations, rather than a simple support zone. Regarding the MACD, the DIFF is -32.44 and the DEA is -27.40, with the histogram still in weak territory, indicating that the daily momentum has not yet fully recovered.
The latest US inflation data has reinforced market concerns about the tail risks of policy tightening. The Consumer Price Index (CPI) rose 0.6% month-over-month and 3.8% year-over-year in April, with the core CPI rising 2.8% year-over-year; energy prices rose 17.9% year-over-year, and gasoline prices rose 28.4% year-over-year. These figures indicate that the energy shock has spread from the commodity market to overall inflation expectations.
This is also why gold's current price movement seems "abnormal." Risk events remain, but the market is worried that after oil prices rise, the Federal Reserve will not only find it difficult to shift to easing quickly, but may even weaken its previous dovish stance in its rhetoric. The latest personal consumption expenditure price index shows that in March, overall PCE rose 3.5% year-on-year, and core PCE rose 3.2% year-on-year, both higher than the comfortable range that policymakers hope to see.
The labor market also failed to provide a sufficiently strong narrative for interest rate cuts for gold. Non-farm payrolls increased by 115,000 in April, with the unemployment rate remaining at 4.3%. While job growth wasn't robust, it wasn't enough to trigger a rapid shift in the market towards a recession trade. This combination is the most challenging for gold: high inflation, no significant slowdown in growth, limited room for policy easing, and resilient real interest rates.
The market is currently exhibiting two trading paths related to the disruption of shipping across the Strait. The first path involves an easing of tensions, a decline in energy prices, a reduction in inflationary pressures, and a resurgence of expectations for interest rate cuts. In this scenario, gold may regain support from declining real interest rates; even if the safe-haven premium recedes somewhat, improved interest rates could buffer against further price declines.
The second scenario is that the blockage in the Taiwan Strait will last longer, allowing Brent crude oil to remain at high levels or even continue to rise. On May 18, Brent crude oil rose to around $112 per barrel, while West Texas Intermediate crude oil touched around $108.70 per barrel, fueling market concerns about the energy supply chain.
The second path is more complex for gold. On the surface, continued tensions would drive safe-haven buying; however, if rising oil prices are translated into expectations of inflation and rising interest rates, gold may exhibit a phase where "the greater the risk, the harder it is for prices to rise." The current trend is closer to this: gold prices haven't deviated from the safe-haven logic, but rather are being repriced by higher real yields.
Therefore, traders need to distinguish between "event risk premium" and "policy risk discount." The former supports gold, while the latter suppresses it. When both exist simultaneously, prices will exhibit wide fluctuations, weak upward momentum, and rapid rebounds after declines, rather than a smooth, one-sided trend.
From the daily chart, the key issue for spot gold is not the single-day bearish candlestick, but rather the confluence of lower highs and a breach of the middle Bollinger Band. After reaching $4889.24, the failure to break through to $4773.37 indicates insufficient buying interest during the rebound. The price then fell to $4480.52, with the low point very close to the lower Bollinger Band area, suggesting that the bearish momentum has not been fully exhausted.
The current price around $4545 appears more like a correction after a decline than a trend confirmation. If the price continues to be capped in the $4600-$4684 range, the daily chart structure will remain weak; only a return above the middle Bollinger Band would suggest that the previous decline may have turned into range-bound trading. The MACD remains below the zero line, indicating that a short-term rebound requires support from trading volume and momentum; otherwise, it is likely to experience repeated low-level fluctuations.
The current chart suggests that gold still has a medium- to long-term investment rationale, but its short-term price is facing a dual test from real interest rates and energy inflation. If subsequent inflation data continues to be overbought and the Federal Reserve releases more cautious signals before its June meeting, valuation pressures on gold may persist. Only if energy prices fall and lead to a decline in real yields will gold prices be able to recover some of their upside potential.
Fundamentally, gold prices are not lacking in safe-haven appeal, but are instead suppressed by rising real interest rates, inflation repricing due to rising energy prices, and expectations of renewed tightening of Federal Reserve policy. While gold is showing signs of stabilizing, high interest rate expectations continue to limit upside potential.
The core reason for the decline in gold prices is not the failure of safe-haven demand, but rather a shift in the pricing anchor.
The key contradiction in this round of spot gold price decline lies in the shift of market pricing focus from "geopolitical risk premium" to "real interest rate penalty." Typically, geopolitical conflicts, shipping disruptions, and energy supply uncertainties increase the safe-haven demand for gold. However, when rising oil prices are interpreted by the market as double-dip inflationary pressure, gold's positive safe-haven attribute is partially offset by higher real interest rates.
In other words, traders are currently not focused on "whether the risk exists," but rather on "whether the risk will ultimately force the Federal Reserve to maintain high interest rates for longer, or even release more hawkish rhetoric." The yield on the 10-year Treasury Inflation-Protected Securities (TIPS) rose to approximately 2.10% on May 18, an increase of about 0.21 percentage points over the past month, indicating that rising risk-free real returns are weakening the relative attractiveness of non-interest-bearing assets.
From a technical perspective, spot gold formed a high near $4889.24, then rebounded to a lower high of $4773.37 before falling back to around $4480.52. After breaking below the middle Bollinger Band, the lower Bollinger Band became the first resistance test zone for short-term fluctuations, rather than a simple support zone. Regarding the MACD, the DIFF is -32.44 and the DEA is -27.40, with the histogram still in weak territory, indicating that the daily momentum has not yet fully recovered.
Second, energy shocks alter inflation paths, putting gold in a tug-of-war between safe-haven buying and interest rate selling pressure.
The latest US inflation data has reinforced market concerns about the tail risks of policy tightening. The Consumer Price Index (CPI) rose 0.6% month-over-month and 3.8% year-over-year in April, with the core CPI rising 2.8% year-over-year; energy prices rose 17.9% year-over-year, and gasoline prices rose 28.4% year-over-year. These figures indicate that the energy shock has spread from the commodity market to overall inflation expectations.
This is also why gold's current price movement seems "abnormal." Risk events remain, but the market is worried that after oil prices rise, the Federal Reserve will not only find it difficult to shift to easing quickly, but may even weaken its previous dovish stance in its rhetoric. The latest personal consumption expenditure price index shows that in March, overall PCE rose 3.5% year-on-year, and core PCE rose 3.2% year-on-year, both higher than the comfortable range that policymakers hope to see.
The labor market also failed to provide a sufficiently strong narrative for interest rate cuts for gold. Non-farm payrolls increased by 115,000 in April, with the unemployment rate remaining at 4.3%. While job growth wasn't robust, it wasn't enough to trigger a rapid shift in the market towards a recession trade. This combination is the most challenging for gold: high inflation, no significant slowdown in growth, limited room for policy easing, and resilient real interest rates.
III. The two paths of cross-strait risk have drastically different implications for gold.
The market is currently exhibiting two trading paths related to the disruption of shipping across the Strait. The first path involves an easing of tensions, a decline in energy prices, a reduction in inflationary pressures, and a resurgence of expectations for interest rate cuts. In this scenario, gold may regain support from declining real interest rates; even if the safe-haven premium recedes somewhat, improved interest rates could buffer against further price declines.
The second scenario is that the blockage in the Taiwan Strait will last longer, allowing Brent crude oil to remain at high levels or even continue to rise. On May 18, Brent crude oil rose to around $112 per barrel, while West Texas Intermediate crude oil touched around $108.70 per barrel, fueling market concerns about the energy supply chain.
The second path is more complex for gold. On the surface, continued tensions would drive safe-haven buying; however, if rising oil prices are translated into expectations of inflation and rising interest rates, gold may exhibit a phase where "the greater the risk, the harder it is for prices to rise." The current trend is closer to this: gold prices haven't deviated from the safe-haven logic, but rather are being repriced by higher real yields.
Therefore, traders need to distinguish between "event risk premium" and "policy risk discount." The former supports gold, while the latter suppresses it. When both exist simultaneously, prices will exhibit wide fluctuations, weak upward momentum, and rapid rebounds after declines, rather than a smooth, one-sided trend.
IV. Technical analysis indicates that gold has entered a period of testing the lower resistance level.
From the daily chart, the key issue for spot gold is not the single-day bearish candlestick, but rather the confluence of lower highs and a breach of the middle Bollinger Band. After reaching $4889.24, the failure to break through to $4773.37 indicates insufficient buying interest during the rebound. The price then fell to $4480.52, with the low point very close to the lower Bollinger Band area, suggesting that the bearish momentum has not been fully exhausted.
The current price around $4545 appears more like a correction after a decline than a trend confirmation. If the price continues to be capped in the $4600-$4684 range, the daily chart structure will remain weak; only a return above the middle Bollinger Band would suggest that the previous decline may have turned into range-bound trading. The MACD remains below the zero line, indicating that a short-term rebound requires support from trading volume and momentum; otherwise, it is likely to experience repeated low-level fluctuations.
The current chart suggests that gold still has a medium- to long-term investment rationale, but its short-term price is facing a dual test from real interest rates and energy inflation. If subsequent inflation data continues to be overbought and the Federal Reserve releases more cautious signals before its June meeting, valuation pressures on gold may persist. Only if energy prices fall and lead to a decline in real yields will gold prices be able to recover some of their upside potential.
- Risk Warning and Disclaimer
- The market involves risk, and trading may not be suitable for all investors. This article is for reference only and does not constitute personal investment advice, nor does it take into account certain users’ specific investment objectives, financial situation, or other needs. Any investment decisions made based on this information are at your own risk.