The US dollar and US Treasury yields are both weakening; how many more days can they hold at their high levels?
2026-05-19 20:12:18
On Tuesday (May 19), the US dollar index and US Treasury yields both showed a tendency to strengthen. The US dollar index was last quoted at 99.2402, trading in a strong range above the middle Bollinger Band; the 10-year US Treasury yield was last quoted at 4.612%, between the middle and upper Bollinger Bands, closely following the upper band, indicating continued short-term strength. Reports from major overseas institutions indicate that the market has become accustomed to long-term yields above 4.5% and 30-year yields above 5%, and the repricing of inflation, geopolitical factors, and fiscal supply and demand continues. In the short term, only one unemployment sales index will be released, and several Federal Reserve officials will speak; market attention will be focused on policy signals and economic data verification.

The US dollar index has been rising steadily since rebounding from a double bottom near 97.62 in early May, reaching a high of 99.4122. It is currently trading at 99.2402, in a high-level consolidation phase. Technically, the Bollinger Band middle line at 99.0652 provides immediate support, while the upper line at 99.5257 constitutes short-term resistance. The Bollinger Bands are showing signs of narrowing. The MACD indicator shows that the DIFF and DEA are above the zero line, but the histogram has slightly turned green to -0.0438, indicating a weakening of short-term upward momentum and a potential for a pullback from these high levels. However, the medium-term upward trend remains intact.
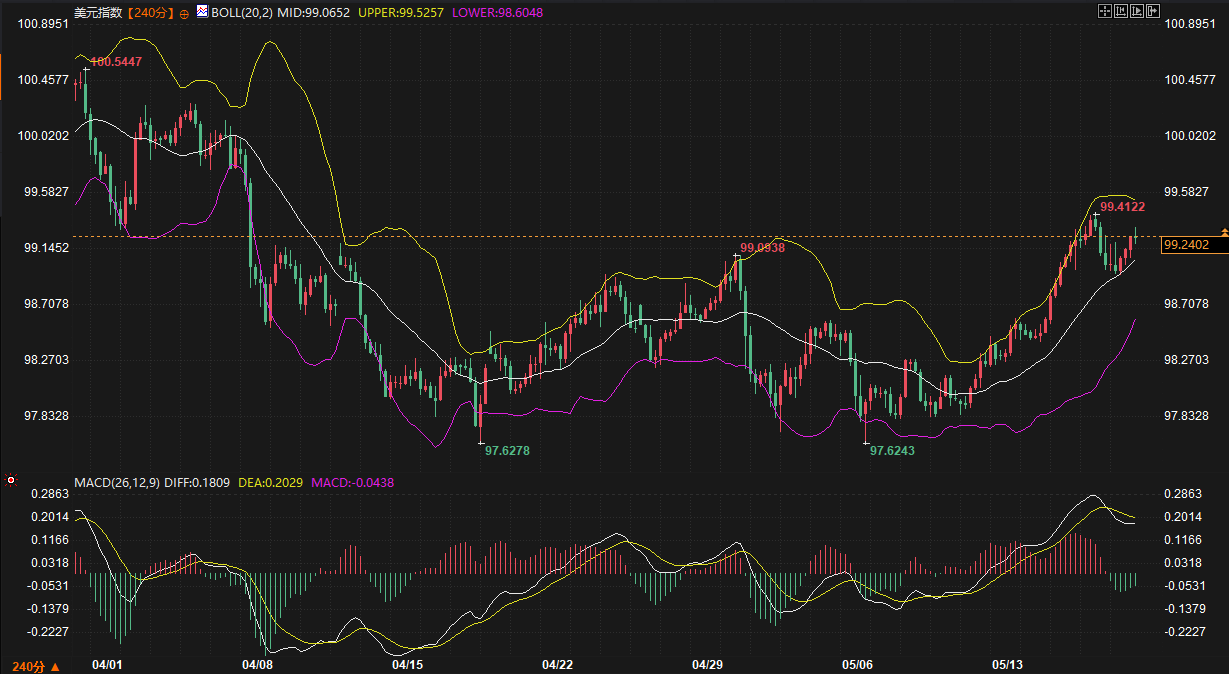
(US Dollar Index Source: FX678)
From a fundamental perspective, recent inflation expectations have rebounded to the 2.7%-2.9% range, coupled with energy prices being affected by geopolitical factors, leading to a more cautious pricing in of the Fed's policy path. Major overseas institutions believe that fiscal expansion and inflationary pressures are jointly pushing up long-term interest rates, thereby supporting the US dollar. The key support level below is around the 99.06 level (the middle band of the Bollinger Bands). If this level holds, the rebound structure will remain intact; if it breaks below, it may test the 98.60-98.80 area.
The 10-year US Treasury yield has been rising in steps since its low of 4.225 in April, accelerating its rise in mid-May to break through previous highs, reaching a peak of 4.630, and is currently trading at 4.612. The Bollinger Band middle line at 4.562 is a key support level, while the upper band at 4.682 provides room for further upward movement; the upward expansion of the Bollinger Bands indicates short-term strength. The MACD lines are above the zero line, and the histogram is near the zero line with a slight green turn, indicating a marginal slowdown in upward momentum, but the bullish trend remains intact.
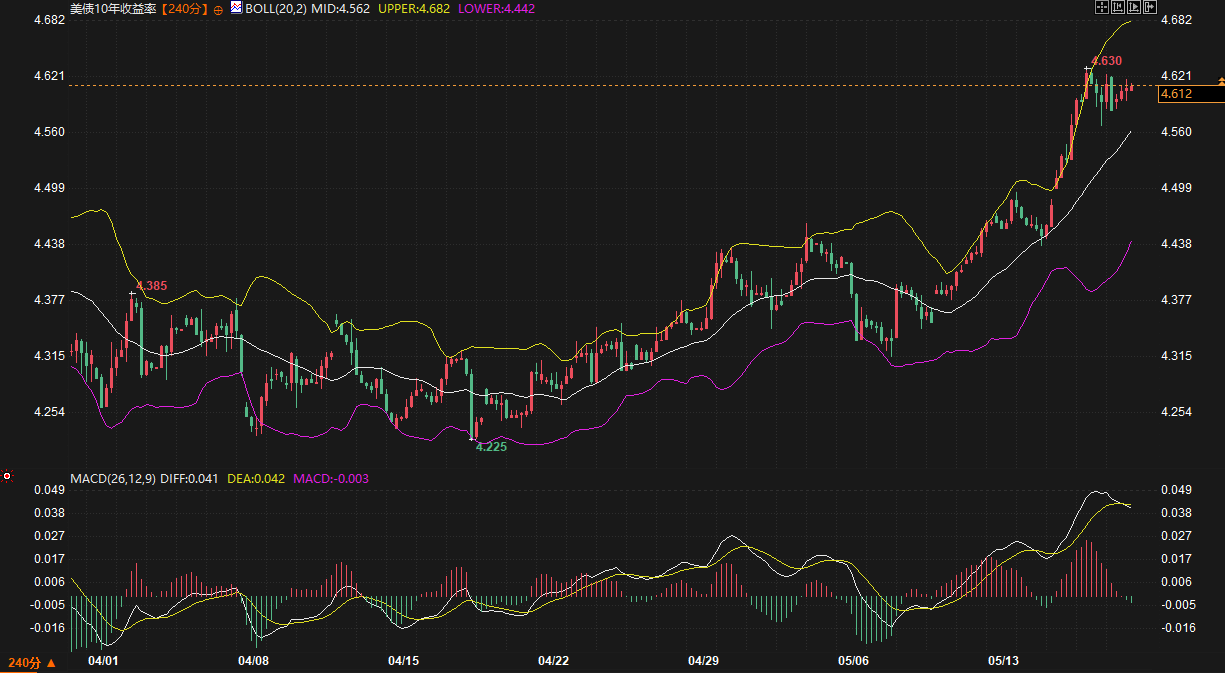
(10-year US Treasury yield source: Easun)
The latest views from major overseas institutions indicate that long-term yields have become relatively "accustomed" to operating above 4.5%, but the attractiveness of global bonds remains constrained by inflation and fiscal issues. Tactically, the 4.60%-4.63% area is considered a potential resistance zone; if resistance is encountered here, fluctuations within the 4.63%-4.57% range are possible; a breakout could lead to further upward movement. From a supply and demand perspective, recent government bond auctions and buy-out operations will provide some technical support, while unemployment sales data and speeches by Federal Reserve officials will directly influence short-term pricing.
The US dollar index and US Treasury yields show a certain positive correlation. Rising yields typically reflect higher real interest rates and rising inflation expectations, supporting the dollar; at the same time, a stronger dollar constrains the performance of non-US assets, further pushing up real yields on US Treasury bonds. Currently, spot gold is trading weakly near the lower Bollinger Band, showing some divergence from the dollar and yield trends, confirming the relative strength of the dollar and yields.
From a technical perspective, the US dollar index's support at 99.06 and the yield's support at 4.562 are both at key mid-range levels. If both hold, it will strengthen the short-term bullish outlook; conversely, a simultaneous break below either could trigger a coordinated pullback. Fundamental drivers include uncertainty surrounding the inflation path, the pace of fiscal spending, and the impact of geopolitical risks on energy prices. These factors will continue to dominate market sentiment over the next 2-3 days.
This week's data is relatively light, with the focus on the unemployment sales index and speeches by Fed officials. Market divergence regarding the Fed's future policy path has become apparent. While the futures market is pricing in a certain probability of an interest rate hike, many analysts believe this pricing may be ahead of actual data. Whether the yield around 4.63% will constitute effective resistance will be the most important technical observation point in the next 2-3 days; the outcome of the dollar index's stress test around 99.4 will also directly influence its short-term direction.
Based on a combination of technical indicators and fundamental drivers, the US dollar index is expected to maintain a high-level consolidation within the 99.00-99.50 range over the next 2-3 days. The 99.06 mid-range level is the primary support level, while the 99.41-99.52 area represents resistance. If the mid-range support holds, there is still a possibility of testing higher levels in the short term. The 10-year US Treasury yield is expected to trade within the 4.56%-4.68% range, with the 4.562 mid-range level acting as key support and the area around 4.63% representing short-term resistance. The overall upward trend remains intact, but momentum is slowing marginally, and increased volatility at high levels should be anticipated. If data or speeches release hawkish signals, or if geopolitical factors continue to disrupt energy prices, yields are likely to remain strong; conversely, if economic data shows signs of slowing demand, a technical correction may occur. In the long run, the dual pressures of inflation and fiscal policy continue to provide upward support for yields, and the medium-term bullish trend of the US dollar is unlikely to change. However, in the short term, attention should be paid to the repeated testing of the 4.56-4.63 and 99.00-99.50 ranges.
Q1: What technical stage is the US dollar index currently in? What are the key support and resistance levels next?
The US dollar index is currently in a relatively strong range above the middle Bollinger Band, exhibiting a high-level consolidation after a bottoming-out rebound. The first support level is at the 99.0652 middle Bollinger Band; if this level holds, the rebound structure will be maintained. Secondary support is around the lower Bollinger Band at 98.60. Resistance is mainly in the 99.41-99.52 range, with the upper Bollinger Band at 99.5257 forming short-term resistance. The MACD histogram turning green indicates weakening momentum, but the above-zero line pattern remains intact, suggesting short-term consolidation is likely.
Q2: What are the driving factors behind the strong rise in the 10-year US Treasury yield? How strong is the support around 4.56%?
The rise in yields was mainly driven by rising inflation expectations, energy price fluctuations, and fiscal supply and demand pressures. The market has gradually adapted to levels above 4.5%, with the Bollinger Band middle line at 4.562 providing significant technical support. Combined with the stepped upward pattern, this level offers strong support. If this level holds, the upward trend remains intact; if it breaks down, it may test the 4.44-4.50 area, but currently, bullish signals still prevail.
Q3: How is the correlation between the US dollar and US Treasury yields reflected in the current environment?
The two exhibit a positive reinforcing relationship. Rising yields reflect higher real interest rates, supporting the US dollar; a stronger dollar further enhances the attractiveness of US Treasuries. The current weak performance of gold also indirectly confirms this correlation. If yields hold above 4.562 and the dollar holds above 99.06, the positive correlation will continue; conversely, a synchronized correction may occur.
Q4: What events will the market focus on in the next 2-3 days? How will they affect market trends?
Key focus will be on the unemployment sales index and speeches by Fed officials. Better-than-expected data or cautious remarks could strengthen yields and support for the dollar; conversely, weaker-than-expected data could provide downward momentum. The 4.63% resistance level and the 99.4% resistance zone will provide directional guidance, with range-bound trading expected to be the most probable scenario.
Q5: Is there a divergence between current market pricing and fundamentals? Where are the risks?
The futures market has priced in interest rate hikes relatively aggressively, but some analysts believe that trading volume is low and the reliability of the signals needs to be verified. The core risks lie in the persistence of inflation and geopolitical factors. If high energy prices are coupled with fiscal expansion, yields could rise more than expected; if signs of weakening economic demand appear ahead of time, it could trigger a yield correction and a period of adjustment in the US dollar. Investors need to pay attention to data verification and the breaking of resistance levels.
US Dollar Index: Rebounding and consolidating at high levels, with momentum slowing.
The US dollar index has been rising steadily since rebounding from a double bottom near 97.62 in early May, reaching a high of 99.4122. It is currently trading at 99.2402, in a high-level consolidation phase. Technically, the Bollinger Band middle line at 99.0652 provides immediate support, while the upper line at 99.5257 constitutes short-term resistance. The Bollinger Bands are showing signs of narrowing. The MACD indicator shows that the DIFF and DEA are above the zero line, but the histogram has slightly turned green to -0.0438, indicating a weakening of short-term upward momentum and a potential for a pullback from these high levels. However, the medium-term upward trend remains intact.
(US Dollar Index Source: FX678)
From a fundamental perspective, recent inflation expectations have rebounded to the 2.7%-2.9% range, coupled with energy prices being affected by geopolitical factors, leading to a more cautious pricing in of the Fed's policy path. Major overseas institutions believe that fiscal expansion and inflationary pressures are jointly pushing up long-term interest rates, thereby supporting the US dollar. The key support level below is around the 99.06 level (the middle band of the Bollinger Bands). If this level holds, the rebound structure will remain intact; if it breaks below, it may test the 98.60-98.80 area.
US Treasury yields: The upward trend is complete, with the 4.56-4.63% range becoming the focus.
The 10-year US Treasury yield has been rising in steps since its low of 4.225 in April, accelerating its rise in mid-May to break through previous highs, reaching a peak of 4.630, and is currently trading at 4.612. The Bollinger Band middle line at 4.562 is a key support level, while the upper band at 4.682 provides room for further upward movement; the upward expansion of the Bollinger Bands indicates short-term strength. The MACD lines are above the zero line, and the histogram is near the zero line with a slight green turn, indicating a marginal slowdown in upward momentum, but the bullish trend remains intact.
(10-year US Treasury yield source: Easun)
The latest views from major overseas institutions indicate that long-term yields have become relatively "accustomed" to operating above 4.5%, but the attractiveness of global bonds remains constrained by inflation and fiscal issues. Tactically, the 4.60%-4.63% area is considered a potential resistance zone; if resistance is encountered here, fluctuations within the 4.63%-4.57% range are possible; a breakout could lead to further upward movement. From a supply and demand perspective, recent government bond auctions and buy-out operations will provide some technical support, while unemployment sales data and speeches by Federal Reserve officials will directly influence short-term pricing.
Cross-market linkage: mutual reinforcement between yields and the US dollar
The US dollar index and US Treasury yields show a certain positive correlation. Rising yields typically reflect higher real interest rates and rising inflation expectations, supporting the dollar; at the same time, a stronger dollar constrains the performance of non-US assets, further pushing up real yields on US Treasury bonds. Currently, spot gold is trading weakly near the lower Bollinger Band, showing some divergence from the dollar and yield trends, confirming the relative strength of the dollar and yields.
From a technical perspective, the US dollar index's support at 99.06 and the yield's support at 4.562 are both at key mid-range levels. If both hold, it will strengthen the short-term bullish outlook; conversely, a simultaneous break below either could trigger a coordinated pullback. Fundamental drivers include uncertainty surrounding the inflation path, the pace of fiscal spending, and the impact of geopolitical risks on energy prices. These factors will continue to dominate market sentiment over the next 2-3 days.
Short-term risk factors and data observation window
This week's data is relatively light, with the focus on the unemployment sales index and speeches by Fed officials. Market divergence regarding the Fed's future policy path has become apparent. While the futures market is pricing in a certain probability of an interest rate hike, many analysts believe this pricing may be ahead of actual data. Whether the yield around 4.63% will constitute effective resistance will be the most important technical observation point in the next 2-3 days; the outcome of the dollar index's stress test around 99.4 will also directly influence its short-term direction.
Trend Outlook
Based on a combination of technical indicators and fundamental drivers, the US dollar index is expected to maintain a high-level consolidation within the 99.00-99.50 range over the next 2-3 days. The 99.06 mid-range level is the primary support level, while the 99.41-99.52 area represents resistance. If the mid-range support holds, there is still a possibility of testing higher levels in the short term. The 10-year US Treasury yield is expected to trade within the 4.56%-4.68% range, with the 4.562 mid-range level acting as key support and the area around 4.63% representing short-term resistance. The overall upward trend remains intact, but momentum is slowing marginally, and increased volatility at high levels should be anticipated. If data or speeches release hawkish signals, or if geopolitical factors continue to disrupt energy prices, yields are likely to remain strong; conversely, if economic data shows signs of slowing demand, a technical correction may occur. In the long run, the dual pressures of inflation and fiscal policy continue to provide upward support for yields, and the medium-term bullish trend of the US dollar is unlikely to change. However, in the short term, attention should be paid to the repeated testing of the 4.56-4.63 and 99.00-99.50 ranges.
Frequently Asked Questions
Q1: What technical stage is the US dollar index currently in? What are the key support and resistance levels next?
The US dollar index is currently in a relatively strong range above the middle Bollinger Band, exhibiting a high-level consolidation after a bottoming-out rebound. The first support level is at the 99.0652 middle Bollinger Band; if this level holds, the rebound structure will be maintained. Secondary support is around the lower Bollinger Band at 98.60. Resistance is mainly in the 99.41-99.52 range, with the upper Bollinger Band at 99.5257 forming short-term resistance. The MACD histogram turning green indicates weakening momentum, but the above-zero line pattern remains intact, suggesting short-term consolidation is likely.
Q2: What are the driving factors behind the strong rise in the 10-year US Treasury yield? How strong is the support around 4.56%?
The rise in yields was mainly driven by rising inflation expectations, energy price fluctuations, and fiscal supply and demand pressures. The market has gradually adapted to levels above 4.5%, with the Bollinger Band middle line at 4.562 providing significant technical support. Combined with the stepped upward pattern, this level offers strong support. If this level holds, the upward trend remains intact; if it breaks down, it may test the 4.44-4.50 area, but currently, bullish signals still prevail.
Q3: How is the correlation between the US dollar and US Treasury yields reflected in the current environment?
The two exhibit a positive reinforcing relationship. Rising yields reflect higher real interest rates, supporting the US dollar; a stronger dollar further enhances the attractiveness of US Treasuries. The current weak performance of gold also indirectly confirms this correlation. If yields hold above 4.562 and the dollar holds above 99.06, the positive correlation will continue; conversely, a synchronized correction may occur.
Q4: What events will the market focus on in the next 2-3 days? How will they affect market trends?
Key focus will be on the unemployment sales index and speeches by Fed officials. Better-than-expected data or cautious remarks could strengthen yields and support for the dollar; conversely, weaker-than-expected data could provide downward momentum. The 4.63% resistance level and the 99.4% resistance zone will provide directional guidance, with range-bound trading expected to be the most probable scenario.
Q5: Is there a divergence between current market pricing and fundamentals? Where are the risks?
The futures market has priced in interest rate hikes relatively aggressively, but some analysts believe that trading volume is low and the reliability of the signals needs to be verified. The core risks lie in the persistence of inflation and geopolitical factors. If high energy prices are coupled with fiscal expansion, yields could rise more than expected; if signs of weakening economic demand appear ahead of time, it could trigger a yield correction and a period of adjustment in the US dollar. Investors need to pay attention to data verification and the breaking of resistance levels.
- Risk Warning and Disclaimer
- The market involves risk, and trading may not be suitable for all investors. This article is for reference only and does not constitute personal investment advice, nor does it take into account certain users’ specific investment objectives, financial situation, or other needs. Any investment decisions made based on this information are at your own risk.