US Treasury yields launch a deadly attack: How much room is left for gold bulls to defend their last line of defense?
2026-05-19 21:31:10
On Tuesday, May 19th, the main trading theme for spot gold shifted from simple geopolitical safe-haven demand to a complex framework encompassing "energy shocks driving inflation, a revaluation of US Treasury yields, and a repricing of the Fed's path." Latest market data shows spot gold fluctuating around $4530/ounce, with an intraday range of approximately $4515 to $4590/ounce; the price has fallen 5.86% over the past month. This indicates that while gold prices remain near their annual highs, short-term funds have significantly reduced their reliance on a single safe-haven logic.
The recent decline in gold prices is not due to a loss of its safe-haven appeal, but rather a shift in the weighting of "inflation protection" versus "holding costs." US inflation data for April showed that overall CPI rose to 3.8% year-on-year, higher than March's 3.3%; core CPI rose to 2.8% year-on-year, and energy prices increased by 17.9% year-on-year. The energy shock did not alone boost gold prices; instead, it reinforced market pricing in higher nominal interest rates.
This is not favorable for gold. Spot gold has no coupon, and when real interest rates and long-term nominal yields rise, the opportunity cost of holding gold increases. The 10-year US Treasury yield recently rose to 4.62%, up 0.02 percentage points from the previous trading day, and up 0.36 percentage points cumulatively over the past month; the US dollar index is at 99.28, up 1.16% this month. The simultaneous strengthening of yields and the dollar constitutes a double constraint on a short-term pullback in gold.
The Federal Reserve's April statement maintained the target range for the federal funds rate at 3.50% to 3.75%, while explicitly mentioning that inflation was high, the recent rise in global energy prices was impacting prices, and emphasizing that the situation in the Middle East had increased uncertainty about the economic outlook. This statement makes it difficult for the gold market to simply interpret geopolitical risks as a one-sided bullish factor, because the same risk source is also pushing up inflation expectations and bond yields.
Brent crude oil was last quoted at $110.24 per barrel, slightly under pressure during the day, but still up 15.46% over the past month. The high oil prices not only signify increased volatility in energy assets, but also indicate that the inflation curve has been pushed back up. As long as oil prices do not return to a level sufficient to alleviate inflation concerns, gold will be caught in a pincer movement: on one hand, hedging demand driven by geopolitical risks, and on the other hand, valuation pressure resulting from inflation pushing up interest rate expectations.
Interest rate futures pricing also reflects this tug-of-war. The probability of the target range for the Fed's December meeting shows a 50.5% probability of 3.50% to 3.75%, but a 38.0% probability of 3.75% to 4.00%, a 10.0% probability of 4.00% to 4.25%, and a 1.1% probability of 4.25% to 4.50%. In other words, the market is no longer just discussing when to ease monetary policy, but is assessing the possibility of maintaining a restrictive interest rate for a longer period, or even further rate hikes.
This is precisely the key reason why gold has struggled to recover quickly after falling to near a one-and-a-half-month low. If geopolitical risks ease, safe-haven buying may reverse; if geopolitical risks escalate, oil prices and inflation expectations may rise simultaneously, further pushing up yields. For gold to escape this dilemma, we need to see a decline in real yields, a weakening dollar, or a significant easing of inflationary pressures from the energy sector.
From the daily chart, spot gold has broken below the Bollinger Band middle line at $4677.03/oz (upper line $4870.22/oz, lower line $4483.84/oz). The current price is around $4530/oz, closer to the lower line, indicating that the short-term focus has shifted from oscillating above the middle line to a weak consolidation near the lower line.
The MACD indicator is also weak, with DIFF at -36.94, DEA at -29.05, and the histogram at -15.78, indicating that momentum remains below the zero line. The key here is not simply to determine if it's "oversold," but to observe whether the price can return to the $4677/ounce area and stabilize. If it can only fluctuate sideways near the lower Bollinger Band, it suggests that the rebound is more of a short-covering and liquidity recovery than a trend reversal.
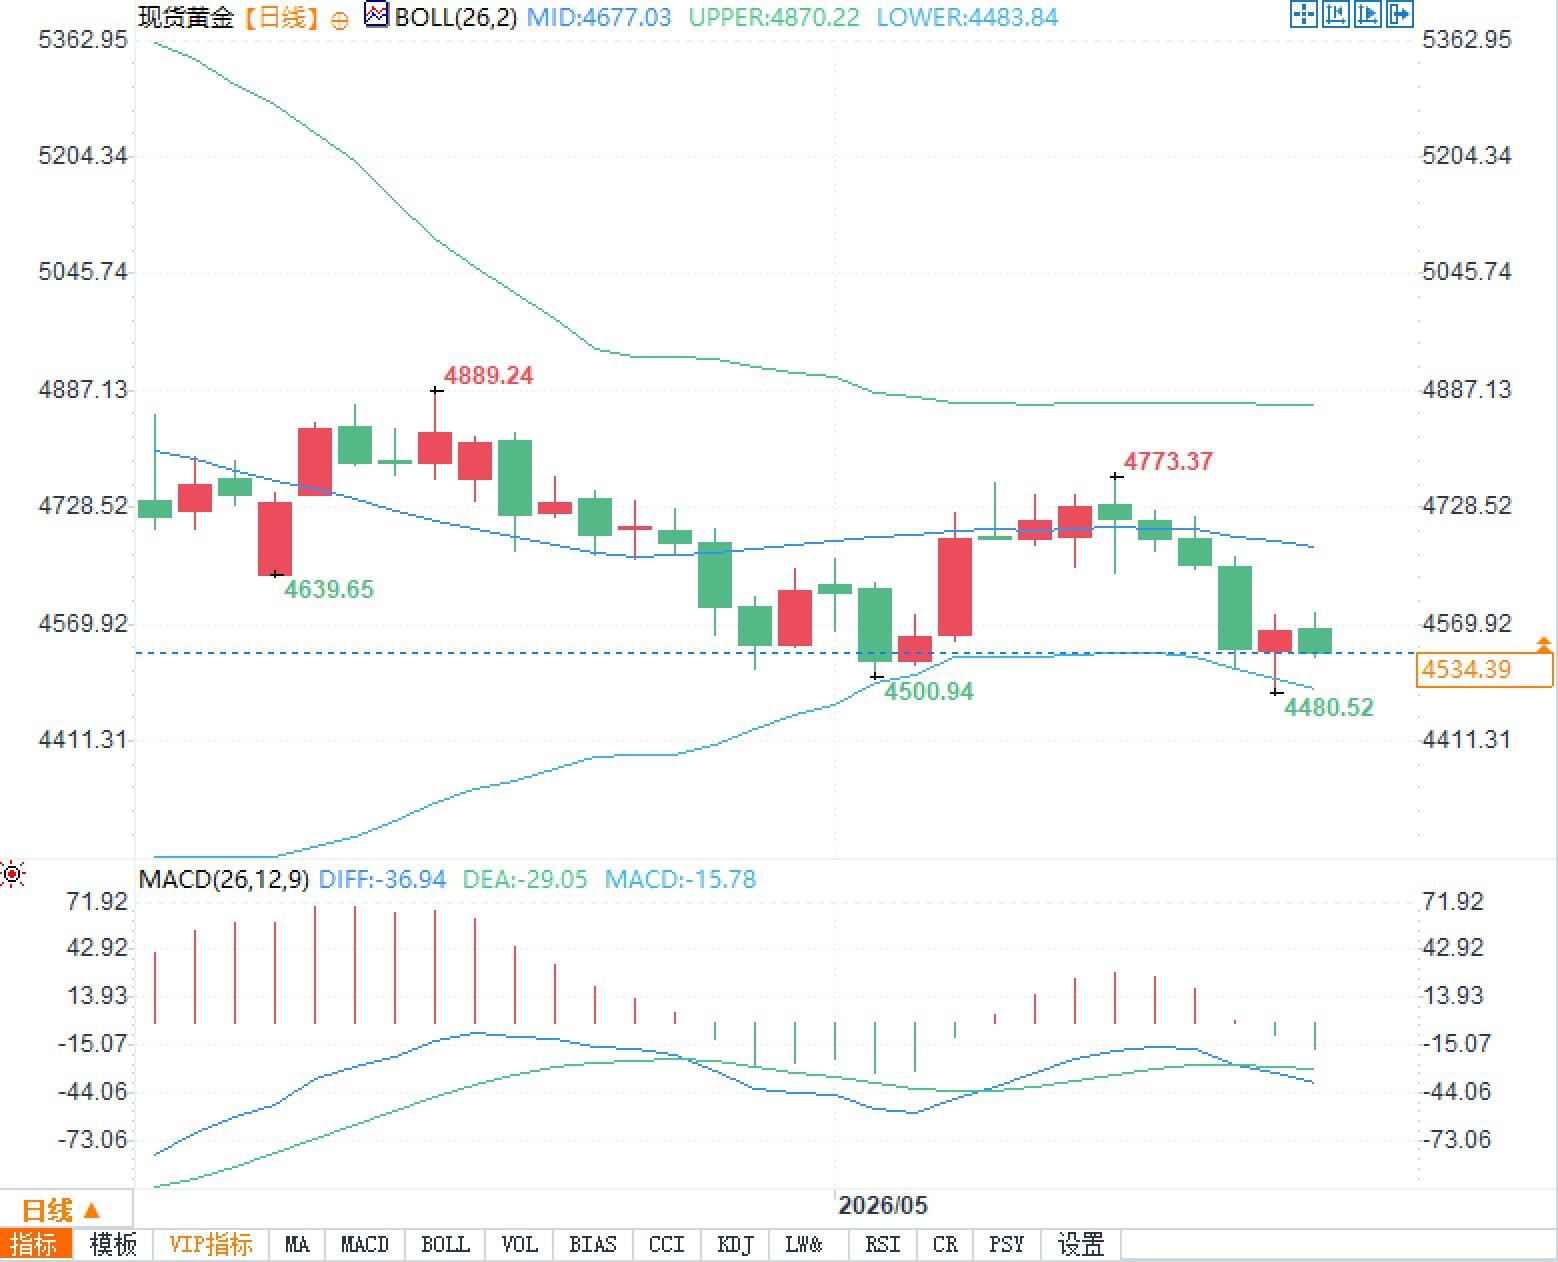
From a structural perspective, the $4480 to $4500/oz range is a recent area of concentrated lows, with $4480.52/oz and $4500.94/oz forming a short-term divergence zone in the chart. The previous rebound high is $4773.37/oz, while the area around $4677/oz corresponds to the Bollinger middle band resistance.
Gold's strength over the past year stemmed from a confluence of factors, including inflation hedging, reserve allocation, geopolitical risks, and changes in real interest rate expectations. However, at the current stage, marginal variables have converged to the interest rate path. As long as the 10-year yield remains around 4.60%, the valuation elasticity of gold in its high-level range will be compressed.
The upcoming minutes of the Federal Reserve meeting are equally important. A statement from the April 28-29 meeting has already been released, but the market still needs the minutes to confirm the extent of disagreement within the committee regarding energy inflation, employment resilience, and subsequent policy adjustments.
If the minutes reinforce the description of inflation risks, gold may continue to face pressure from yields; only if the minutes show that policymakers remain cautious about the second wave of energy shocks but are not in a hurry to tighten, gold may gain a breathing space. More importantly, gold does not lack a long-term narrative, but rather short-term catalysts. The current price is near the lower Bollinger Band, indicating that the market has already priced in some negative news, but has not yet confirmed the removal of macroeconomic constraints.
Yield suppression becomes the core variable for gold's pullback.
The recent decline in gold prices is not due to a loss of its safe-haven appeal, but rather a shift in the weighting of "inflation protection" versus "holding costs." US inflation data for April showed that overall CPI rose to 3.8% year-on-year, higher than March's 3.3%; core CPI rose to 2.8% year-on-year, and energy prices increased by 17.9% year-on-year. The energy shock did not alone boost gold prices; instead, it reinforced market pricing in higher nominal interest rates.
This is not favorable for gold. Spot gold has no coupon, and when real interest rates and long-term nominal yields rise, the opportunity cost of holding gold increases. The 10-year US Treasury yield recently rose to 4.62%, up 0.02 percentage points from the previous trading day, and up 0.36 percentage points cumulatively over the past month; the US dollar index is at 99.28, up 1.16% this month. The simultaneous strengthening of yields and the dollar constitutes a double constraint on a short-term pullback in gold.
The Federal Reserve's April statement maintained the target range for the federal funds rate at 3.50% to 3.75%, while explicitly mentioning that inflation was high, the recent rise in global energy prices was impacting prices, and emphasizing that the situation in the Middle East had increased uncertainty about the economic outlook. This statement makes it difficult for the gold market to simply interpret geopolitical risks as a one-sided bullish factor, because the same risk source is also pushing up inflation expectations and bond yields.
High crude oil prices are altering the pricing logic of safe-haven assets.
Brent crude oil was last quoted at $110.24 per barrel, slightly under pressure during the day, but still up 15.46% over the past month. The high oil prices not only signify increased volatility in energy assets, but also indicate that the inflation curve has been pushed back up. As long as oil prices do not return to a level sufficient to alleviate inflation concerns, gold will be caught in a pincer movement: on one hand, hedging demand driven by geopolitical risks, and on the other hand, valuation pressure resulting from inflation pushing up interest rate expectations.
Interest rate futures pricing also reflects this tug-of-war. The probability of the target range for the Fed's December meeting shows a 50.5% probability of 3.50% to 3.75%, but a 38.0% probability of 3.75% to 4.00%, a 10.0% probability of 4.00% to 4.25%, and a 1.1% probability of 4.25% to 4.50%. In other words, the market is no longer just discussing when to ease monetary policy, but is assessing the possibility of maintaining a restrictive interest rate for a longer period, or even further rate hikes.
This is precisely the key reason why gold has struggled to recover quickly after falling to near a one-and-a-half-month low. If geopolitical risks ease, safe-haven buying may reverse; if geopolitical risks escalate, oil prices and inflation expectations may rise simultaneously, further pushing up yields. For gold to escape this dilemma, we need to see a decline in real yields, a weakening dollar, or a significant easing of inflationary pressures from the energy sector.
Technical analysis suggests that the short position has not yet fully exhausted.
From the daily chart, spot gold has broken below the Bollinger Band middle line at $4677.03/oz (upper line $4870.22/oz, lower line $4483.84/oz). The current price is around $4530/oz, closer to the lower line, indicating that the short-term focus has shifted from oscillating above the middle line to a weak consolidation near the lower line.
The MACD indicator is also weak, with DIFF at -36.94, DEA at -29.05, and the histogram at -15.78, indicating that momentum remains below the zero line. The key here is not simply to determine if it's "oversold," but to observe whether the price can return to the $4677/ounce area and stabilize. If it can only fluctuate sideways near the lower Bollinger Band, it suggests that the rebound is more of a short-covering and liquidity recovery than a trend reversal.
From a structural perspective, the $4480 to $4500/oz range is a recent area of concentrated lows, with $4480.52/oz and $4500.94/oz forming a short-term divergence zone in the chart. The previous rebound high is $4773.37/oz, while the area around $4677/oz corresponds to the Bollinger middle band resistance.
The key in the short term is not risk aversion, but whether interest rate expectations will ease.
Gold's strength over the past year stemmed from a confluence of factors, including inflation hedging, reserve allocation, geopolitical risks, and changes in real interest rate expectations. However, at the current stage, marginal variables have converged to the interest rate path. As long as the 10-year yield remains around 4.60%, the valuation elasticity of gold in its high-level range will be compressed.
The upcoming minutes of the Federal Reserve meeting are equally important. A statement from the April 28-29 meeting has already been released, but the market still needs the minutes to confirm the extent of disagreement within the committee regarding energy inflation, employment resilience, and subsequent policy adjustments.
If the minutes reinforce the description of inflation risks, gold may continue to face pressure from yields; only if the minutes show that policymakers remain cautious about the second wave of energy shocks but are not in a hurry to tighten, gold may gain a breathing space. More importantly, gold does not lack a long-term narrative, but rather short-term catalysts. The current price is near the lower Bollinger Band, indicating that the market has already priced in some negative news, but has not yet confirmed the removal of macroeconomic constraints.
- Risk Warning and Disclaimer
- The market involves risk, and trading may not be suitable for all investors. This article is for reference only and does not constitute personal investment advice, nor does it take into account certain users’ specific investment objectives, financial situation, or other needs. Any investment decisions made based on this information are at your own risk.