Why did gold prices fall today? June gold price forecast.
2026-05-27 00:51:23
On Tuesday (May 26), spot gold prices continued to decline in the US market, while spot silver prices fell even more significantly. A stronger dollar and increased volatility in the oil market offset some of the support from falling Treasury yields. Spot gold fell 1.4% to $4,506.56 per ounce; June-delivery US gold futures were unchanged at $4,506.9 per ounce; and spot silver fell 2.46% to $76.118 per ounce.

The main reason for today's gold price decline
Following the US military strike on Iran, Brent crude oil prices surged, completely dashing market expectations for a rapid easing of tensions in the Middle East and significantly fueling inflation concerns.
This military action directly impacts the security of the Strait of Hormuz, a crucial energy corridor, and increases global energy supply risks. US Secretary of State Marco Rubio stated on Tuesday that US-Iran negotiations "will take several more days" to yield results, further exacerbating market uncertainty. High oil prices will further push up inflation expectations, forcing the Federal Reserve to maintain higher interest rates for an extended period. While gold has long been considered an effective inflation hedge, as a non-interest-bearing asset, its holding costs rise relatively in a high-interest-rate environment, significantly weakening its attractiveness and putting downward pressure on gold prices.
Meanwhile, the strengthening of the US dollar index and the rebound in US Treasury yields have significantly increased the opportunity cost of holding gold. ActivTrades analyst Ricardo Evangelista stated, "Geopolitical uncertainty has pushed up oil prices, exacerbated market concerns about inflation, and strengthened market expectations of the Federal Reserve tightening monetary policy, which is a significant negative factor for gold, a non-interest-bearing asset."
Traders are currently closely monitoring the latest developments in US-Iran negotiations, while also awaiting the release of US April personal consumption expenditure (PCE) inflation data this Thursday to gauge the direction of monetary policy. According to the CME FedWatch Tool, the market currently expects the Fed to raise interest rates again this year, with a 41% probability of a 25 basis point hike in December.
Latest views from institutions
Marex analyst Edward Meir points out that a strong dollar and persistently high Treasury yields are the main factors currently suppressing gold prices, while inflationary expectations triggered by a rebound in oil prices further exacerbate this pressure. Higher yields increase the opportunity cost of holding non-yielding assets, while a stronger dollar makes gold more expensive for holders of other currencies.
UBS recently lowered its year-end target price for gold by $400 to $5,500 per ounce, primarily due to persistent macroeconomic risks such as high US Treasury yields and a continued strengthening US dollar. However, UBS also maintained a relatively optimistic outlook in its research report, pointing out that long-term trends such as high global debt levels, a widening US fiscal deficit, and central banks' efforts to diversify their foreign exchange reserves will significantly enhance the strategic allocation value of physical gold. UBS expects that gold will continue to receive strong support as oil prices are expected to gradually decline by the end of the year.
June Gold Price Outlook
In the short term, gold prices are likely to fluctuate within the $4,500-$4,580 range. If geopolitical risks in the Strait of Hormuz continue to escalate, safe-haven buying could drive a rebound in gold prices; conversely, if substantial progress is made in US-Iran peace talks or oil prices decline significantly, easing inflationary pressures will further suppress gold and silver prices.
Following Monday's Memorial Day holiday, the US economic data release schedule has fully resumed. Traders are focusing on the March S&P/Case-Shiller Home Price Index and the May Consumer Confidence Index, both released this morning, with manufacturing and inflation-related data to follow in the coming days. Currently, the 10-year Treasury yield is around 4.5%, but a strong dollar remains a major factor suppressing gold prices.
Silver, possessing both industrial demand and precious metal attributes, is more significantly affected by oil prices and the US dollar's movements, exhibiting much greater short-term volatility than gold. Analysts generally believe that industrial demand, particularly for green energy sources such as solar power, will continue to provide medium- to long-term support for silver.
Technical Analysis
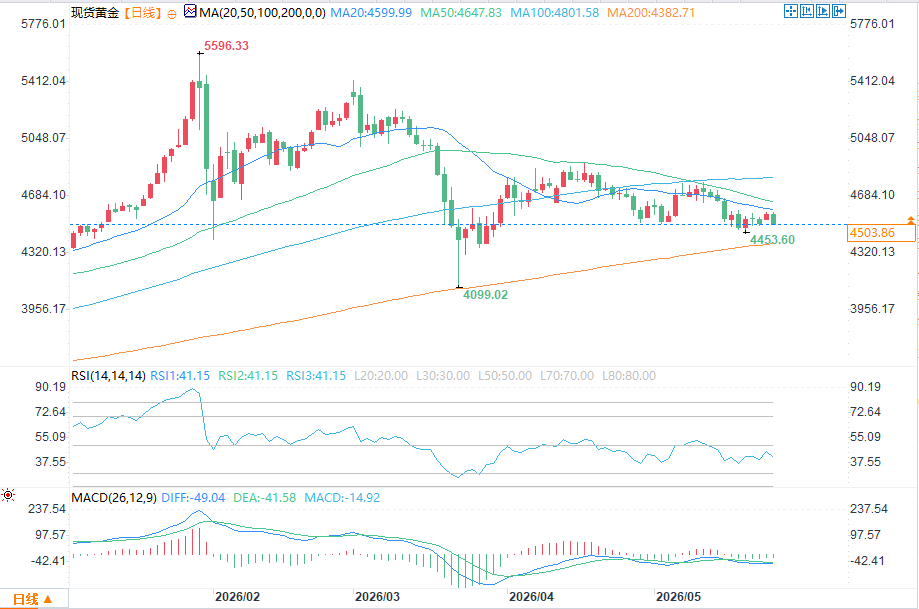
(Spot gold daily chart source: FX678)
Bullish gold investors are targeting a return above the $4523-$4546 resistance zone, with further targets at $4573 and $4581. Bearish investors are focusing on a decisive break below the $4503.20 support level, with further downside targets at $4490 and $4453. The first resistance level is $4523, followed by $4546; the first support level is $4503.20, followed by $4490.
Bullish investors in silver are targeting a move above the $76.80-$78.00 range, with further targets at $78.92 and $83.61. Bears are watching for a break below the $75.55 support level, with further downside targets at $75.00 and $74.68. The first resistance level is $76.80, followed by $78.00; support levels are $75.55 and $75.00.
The main reason for today's gold price decline
Following the US military strike on Iran, Brent crude oil prices surged, completely dashing market expectations for a rapid easing of tensions in the Middle East and significantly fueling inflation concerns.
This military action directly impacts the security of the Strait of Hormuz, a crucial energy corridor, and increases global energy supply risks. US Secretary of State Marco Rubio stated on Tuesday that US-Iran negotiations "will take several more days" to yield results, further exacerbating market uncertainty. High oil prices will further push up inflation expectations, forcing the Federal Reserve to maintain higher interest rates for an extended period. While gold has long been considered an effective inflation hedge, as a non-interest-bearing asset, its holding costs rise relatively in a high-interest-rate environment, significantly weakening its attractiveness and putting downward pressure on gold prices.
Meanwhile, the strengthening of the US dollar index and the rebound in US Treasury yields have significantly increased the opportunity cost of holding gold. ActivTrades analyst Ricardo Evangelista stated, "Geopolitical uncertainty has pushed up oil prices, exacerbated market concerns about inflation, and strengthened market expectations of the Federal Reserve tightening monetary policy, which is a significant negative factor for gold, a non-interest-bearing asset."
Traders are currently closely monitoring the latest developments in US-Iran negotiations, while also awaiting the release of US April personal consumption expenditure (PCE) inflation data this Thursday to gauge the direction of monetary policy. According to the CME FedWatch Tool, the market currently expects the Fed to raise interest rates again this year, with a 41% probability of a 25 basis point hike in December.
Latest views from institutions
Marex analyst Edward Meir points out that a strong dollar and persistently high Treasury yields are the main factors currently suppressing gold prices, while inflationary expectations triggered by a rebound in oil prices further exacerbate this pressure. Higher yields increase the opportunity cost of holding non-yielding assets, while a stronger dollar makes gold more expensive for holders of other currencies.
UBS recently lowered its year-end target price for gold by $400 to $5,500 per ounce, primarily due to persistent macroeconomic risks such as high US Treasury yields and a continued strengthening US dollar. However, UBS also maintained a relatively optimistic outlook in its research report, pointing out that long-term trends such as high global debt levels, a widening US fiscal deficit, and central banks' efforts to diversify their foreign exchange reserves will significantly enhance the strategic allocation value of physical gold. UBS expects that gold will continue to receive strong support as oil prices are expected to gradually decline by the end of the year.
June Gold Price Outlook
In the short term, gold prices are likely to fluctuate within the $4,500-$4,580 range. If geopolitical risks in the Strait of Hormuz continue to escalate, safe-haven buying could drive a rebound in gold prices; conversely, if substantial progress is made in US-Iran peace talks or oil prices decline significantly, easing inflationary pressures will further suppress gold and silver prices.
Following Monday's Memorial Day holiday, the US economic data release schedule has fully resumed. Traders are focusing on the March S&P/Case-Shiller Home Price Index and the May Consumer Confidence Index, both released this morning, with manufacturing and inflation-related data to follow in the coming days. Currently, the 10-year Treasury yield is around 4.5%, but a strong dollar remains a major factor suppressing gold prices.
Silver, possessing both industrial demand and precious metal attributes, is more significantly affected by oil prices and the US dollar's movements, exhibiting much greater short-term volatility than gold. Analysts generally believe that industrial demand, particularly for green energy sources such as solar power, will continue to provide medium- to long-term support for silver.
Technical Analysis
(Spot gold daily chart source: FX678)
Bullish gold investors are targeting a return above the $4523-$4546 resistance zone, with further targets at $4573 and $4581. Bearish investors are focusing on a decisive break below the $4503.20 support level, with further downside targets at $4490 and $4453. The first resistance level is $4523, followed by $4546; the first support level is $4503.20, followed by $4490.
Bullish investors in silver are targeting a move above the $76.80-$78.00 range, with further targets at $78.92 and $83.61. Bears are watching for a break below the $75.55 support level, with further downside targets at $75.00 and $74.68. The first resistance level is $76.80, followed by $78.00; support levels are $75.55 and $75.00.
- Risk Warning and Disclaimer
- The market involves risk, and trading may not be suitable for all investors. This article is for reference only and does not constitute personal investment advice, nor does it take into account certain users’ specific investment objectives, financial situation, or other needs. Any investment decisions made based on this information are at your own risk.