Escalating geopolitical risks vs. rebounding US Treasury yields: Gold caught in a dilemma.
2026-05-27 10:35:51
On Wednesday (May 27) during Asian trading hours, spot gold fluctuated slightly lower, briefly falling below $4,500/oz to $4,498/oz, and is currently trading around $4,505/oz, as investors digest another reversal in the US-Iran situation.
While geopolitical uncertainty typically fuels stronger safe-haven buying of gold, the situation has been complicated this time by a rebound in energy prices and bond yields.
The latest US strikes on Iranian targets have fueled market doubts about how close Washington and Tehran are to reaching an agreement. Just days earlier, Trump had said negotiations were "going well," which on Monday bolstered risk appetite and briefly eased concerns about escalating regional tensions; now, that optimism appears more fragile.
Despite renewed tensions, gold failed to attract significant safe-haven inflows. Instead, a stronger dollar and modest yield increases kept gold prices hovering around familiar levels, suggesting that downward pressure is re-accumulating.
Currently, gold prices appear to be increasingly driven by oil prices and US Treasury yields, rather than purely by geopolitical factors. The rebound in oil prices today following the US military strikes has reignited market concerns that a peace agreement is not yet close and that inflationary pressures may persist for a longer period.
If energy markets continue to climb, bond yields could remain high as traders push forward with expectations of a Federal Reserve monetary tightening.
This dynamic creates a challenging environment for gold: higher yields increase the opportunity cost of holding non-interest-bearing assets like gold, limiting the potential for a sustained rally during periods of geopolitical uncertainty.
Meanwhile, markets remain highly sensitive to any signs of progress in US-Iran diplomacy. Confirmation of an agreement could reduce immediate tensions in the region, thus putting downward pressure on oil prices and easing inflation concerns.
In this scenario, declining yields could ultimately provide more meaningful support for gold prices. However, neither scenario is currently dominant, leaving gold prices stuck in an unsettling middle ground with a slight downward bias in the short term.
Citibank believes that once the US and Iran reach an agreement and navigation resumes in the Strait of Hormuz, falling oil prices will weaken inflation expectations, push up real interest rates, and thus suppress gold prices. The bank has set a three-month gold price target of $4,300 per ounce.
Goldman Sachs maintained its bullish view and raised its global central bank gold purchase forecast, reiterating its year-end gold price target of $5,400 per ounce. This is based on continued central bank gold purchases and market expectations of two more US interest rate cuts this year.
Morgan Stanley was the first to lower its forecast at the end of April, revising its gold price target for the second half of 2026 down to $5,200 per ounce. Their core logic is that geopolitical conflicts are causing real interest rates to rise and the Federal Reserve is delaying rate cuts, thus normalizing the classic negative correlation between gold and real interest rates. They believe gold is shifting from a "safe-haven trade" to an "interest rate trade."
From the daily chart, spot gold is currently trading around $4,500, in a weak consolidation phase after a recent pullback from highs, with multiple technical indicators showing bearish signals.
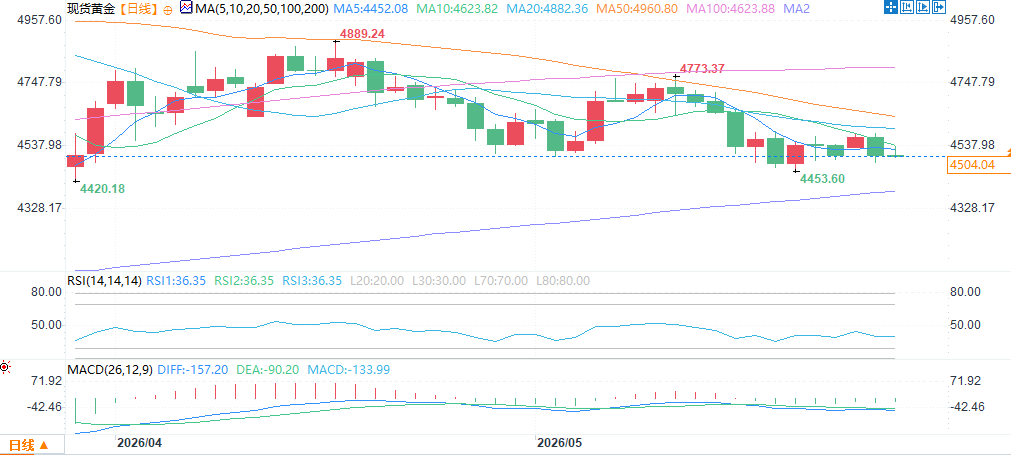
(Spot gold daily chart, source: FX678)
In terms of moving averages, the current price has fallen below all major moving averages except the 200-day moving average. The 5-day moving average (MA5) is below the current price, while the 10-day (MA10) (4623.82), 20-day (MA20) (4882.36), 50-day (MA50) (4960.80), and 100-day (MA100) (4623.88) are all significantly higher than the current price, forming layers of resistance. This bearish alignment of "price below most major moving averages" indicates that gold is in a clear downtrend, with increasing pressure for a short-term pullback. It is worth noting that since the price fell from above $4950 in mid-May, it has been trading below the 20-day moving average for several consecutive trading days, clearly indicating a short-term bearish pattern.
In conclusion, gold remains trapped in a highly news-sensitive trading environment. The market is attempting to balance conflicting forces: geopolitical instability, oil price volatility, uncertain Federal Reserve expectations, and the possibility of a diplomatic breakthrough between the US and Iran. Unless a clear agreement emerges in the coming days, volatile trading is likely to continue.
At 10:33 AM Beijing time on May 27, spot gold was trading at $4,505.12 per ounce.
While geopolitical uncertainty typically fuels stronger safe-haven buying of gold, the situation has been complicated this time by a rebound in energy prices and bond yields.
The latest US strikes on Iranian targets have fueled market doubts about how close Washington and Tehran are to reaching an agreement. Just days earlier, Trump had said negotiations were "going well," which on Monday bolstered risk appetite and briefly eased concerns about escalating regional tensions; now, that optimism appears more fragile.
Oil prices and US Treasury yields remain key drivers.
Despite renewed tensions, gold failed to attract significant safe-haven inflows. Instead, a stronger dollar and modest yield increases kept gold prices hovering around familiar levels, suggesting that downward pressure is re-accumulating.
Currently, gold prices appear to be increasingly driven by oil prices and US Treasury yields, rather than purely by geopolitical factors. The rebound in oil prices today following the US military strikes has reignited market concerns that a peace agreement is not yet close and that inflationary pressures may persist for a longer period.
If energy markets continue to climb, bond yields could remain high as traders push forward with expectations of a Federal Reserve monetary tightening.
This dynamic creates a challenging environment for gold: higher yields increase the opportunity cost of holding non-interest-bearing assets like gold, limiting the potential for a sustained rally during periods of geopolitical uncertainty.
The market is highly sensitive to geopolitical news, and gold prices are caught in a tug-of-war.
Meanwhile, markets remain highly sensitive to any signs of progress in US-Iran diplomacy. Confirmation of an agreement could reduce immediate tensions in the region, thus putting downward pressure on oil prices and easing inflation concerns.
In this scenario, declining yields could ultimately provide more meaningful support for gold prices. However, neither scenario is currently dominant, leaving gold prices stuck in an unsettling middle ground with a slight downward bias in the short term.
Institutional Views
Citibank believes that once the US and Iran reach an agreement and navigation resumes in the Strait of Hormuz, falling oil prices will weaken inflation expectations, push up real interest rates, and thus suppress gold prices. The bank has set a three-month gold price target of $4,300 per ounce.
Goldman Sachs maintained its bullish view and raised its global central bank gold purchase forecast, reiterating its year-end gold price target of $5,400 per ounce. This is based on continued central bank gold purchases and market expectations of two more US interest rate cuts this year.
Morgan Stanley was the first to lower its forecast at the end of April, revising its gold price target for the second half of 2026 down to $5,200 per ounce. Their core logic is that geopolitical conflicts are causing real interest rates to rise and the Federal Reserve is delaying rate cuts, thus normalizing the classic negative correlation between gold and real interest rates. They believe gold is shifting from a "safe-haven trade" to an "interest rate trade."
Spot Gold Daily Technical Analysis
From the daily chart, spot gold is currently trading around $4,500, in a weak consolidation phase after a recent pullback from highs, with multiple technical indicators showing bearish signals.
(Spot gold daily chart, source: FX678)
In terms of moving averages, the current price has fallen below all major moving averages except the 200-day moving average. The 5-day moving average (MA5) is below the current price, while the 10-day (MA10) (4623.82), 20-day (MA20) (4882.36), 50-day (MA50) (4960.80), and 100-day (MA100) (4623.88) are all significantly higher than the current price, forming layers of resistance. This bearish alignment of "price below most major moving averages" indicates that gold is in a clear downtrend, with increasing pressure for a short-term pullback. It is worth noting that since the price fell from above $4950 in mid-May, it has been trading below the 20-day moving average for several consecutive trading days, clearly indicating a short-term bearish pattern.
Market sentiment is fragile, and gold prices are expected to remain highly volatile in the short term.
In conclusion, gold remains trapped in a highly news-sensitive trading environment. The market is attempting to balance conflicting forces: geopolitical instability, oil price volatility, uncertain Federal Reserve expectations, and the possibility of a diplomatic breakthrough between the US and Iran. Unless a clear agreement emerges in the coming days, volatile trading is likely to continue.
At 10:33 AM Beijing time on May 27, spot gold was trading at $4,505.12 per ounce.
- Risk Warning and Disclaimer
- The market involves risk, and trading may not be suitable for all investors. This article is for reference only and does not constitute personal investment advice, nor does it take into account certain users’ specific investment objectives, financial situation, or other needs. Any investment decisions made based on this information are at your own risk.