Gold's sharp rebound: PCE data ignites the fuse, Castle Securities points out the biggest overlooked variable.
2026-05-29 02:23:06
On Thursday (May 28), international gold prices fell to $4,366 per ounce during the session, hitting a nearly two-month low. However, on the same day, gold prices staged a dramatic reversal, quickly climbing from the low to the $4,480 area, a single-day rebound of about 2.6%, catching many short sellers off guard. Entering the Asian and European sessions on May 29, gold prices continued to consolidate in the $4,400 to $4,460 range, with bullish sentiment gradually recovering.

The rapid rebound following this sharp decline was no accident. From fundamentals to technicals, multiple forces combined at the same time, igniting this fuse.
Looking back at the entire month of May, gold prices fell sharply from their all-time high of $5,589 (reached on January 29th). At the beginning of the month, it encountered resistance from the 50-day moving average near $4,774, and subsequently declined steadily. This drop has exceeded 10%, quite similar to the historic plunge in March 2026 triggered by escalating geopolitical tensions (a single-month drop of over 10%, the largest monthly decline since June 2013), indicating that oversold sentiment has been quietly accumulating in the market. Year-to-date, despite some correction, gold has still risen more than 34% from the $3,300 area a year ago, and the long-term bull market trend remains fundamentally unchanged.
PCE Data: The Core Catalyst for the Rebound
The most crucial trigger for this rebound is the Fed's favorite inflation indicator—the core PCE (Personal Consumption Expenditures Price Index).
The core PCE data released on May 28 showed a month-on-month increase of only 0.2%, significantly lower than the market expectation of 0.3% and a marked decline from the previous 0.4%. This data brought a sigh of relief to the market.
Previously, tensions in the Strait of Hormuz persisted due to the geopolitical and military conflict between the United States and Iran, causing oil prices to surge and the market widely expecting energy-driven inflation to rise again. Federal Reserve Vice Chairman Philip Jefferson, in a speech on the same day, acknowledged that rising oil prices were a "downside risk to growth" and a "potential driver of inflation," emphasizing the Fed's "firm commitment to restoring inflation to its 2% target."
However, the weaker-than-expected PCE data delivered a pleasant surprise to the market—inflationary pressures may not be as severe as anticipated. This directly lowered the US dollar index, boosted US Treasury bonds, and made gold, a non-yielding asset, a favorite among investors. From a market perspective, whenever core PCE falls short of expectations, market expectations for a Fed rate cut this year rise, and gold prices benefit accordingly; this time was no exception.
Multiple data points resonate, solidifying the foundation for a rebound.
The PCE is not fighting alone; multiple economic data released simultaneously have collectively provided fundamental support for the gold price rebound.
The second revision to Q1 GDP figures. The U.S. Commerce Department lowered its Q1 2026 GDP growth forecast from the initial 2.0% to 1.6%, below market expectations, reflecting a slowdown in both private inventory investment and consumer spending. The weaker-than-expected economic growth means the Federal Reserve has less need to maintain high interest rates, objectively leaving room for expectations of rate cuts, which is somewhat positive for gold.
Initial jobless claims. The number of initial jobless claims released at the same time rose, further supporting market expectations of a shift in Federal Reserve policy. Renowned economist Mark Zandi estimates the probability of a US recession within the next year at 40%, far higher than the historical average of 15%, leading to a resurgence in safe-haven demand.
Durable goods orders. April's durable goods orders data showed slight fluctuations, with overall concerns about the state of the manufacturing sector intensifying, further fueling the narrative of an economic slowdown.
The U.S. Census Bureau and the U.S. Department of Housing and Urban Development announced Thursday that new home sales fell 6.2% in April to a seasonally adjusted year-over-year rate of 622,000 units. This figure is lower than March's 663,000 units. The actual decline far exceeded expectations.
The US dollar index weakened. Following the release of the aforementioned data, the US dollar index came under pressure and fell. The negative correlation between gold and the US dollar meant that gold prices naturally benefited from a weaker dollar, providing additional upward momentum.
These sets of data all point to a very clear picture: the economy is cooling down, and the rebound in inflation may be milder than previously feared, giving gold bulls a rare chance to breathe.
Technical Analysis: The 200-day moving average forms a natural protective barrier.
Whether positive fundamentals can translate into a sustained rebound depends heavily on technical support. This rebound, in particular, has occurred at a crucial technical juncture: the 200-day simple moving average.
Currently, the 200-day moving average for spot gold is located in the area of approximately $4,357 to $4,399. The intraday low of $4,366 on May 28th precisely touched this key moving average before a strong rebound, making it a textbook example of established technical support.
From a technical analysis perspective, the 200-day moving average is a "watershed" for distinguishing between long-term bull and bear markets: when the price is above the moving average, the bulls are in control; when it falls below the moving average and closes below it, it often indicates a greater downside risk. On May 28, although the price briefly fell below this line during the day, it ultimately held this key position at the close, showing that the bulls had a strong willingness to defend the price at this level.
Meanwhile, looking at overbought and oversold indicators, the RSI (Relative Strength Index) has fallen to around 38-39, entering near oversold territory, and the CCI (Commodity Channel Index) has also issued an oversold signal, making a technical "oversold rebound" demand very clear. Combined with the triangle consolidation pattern formed by continuous price compression in May, technical analysts generally believe that a significant directional breakout is poised to occur.
Support and Resistance: Where is the Battleground in the Future?
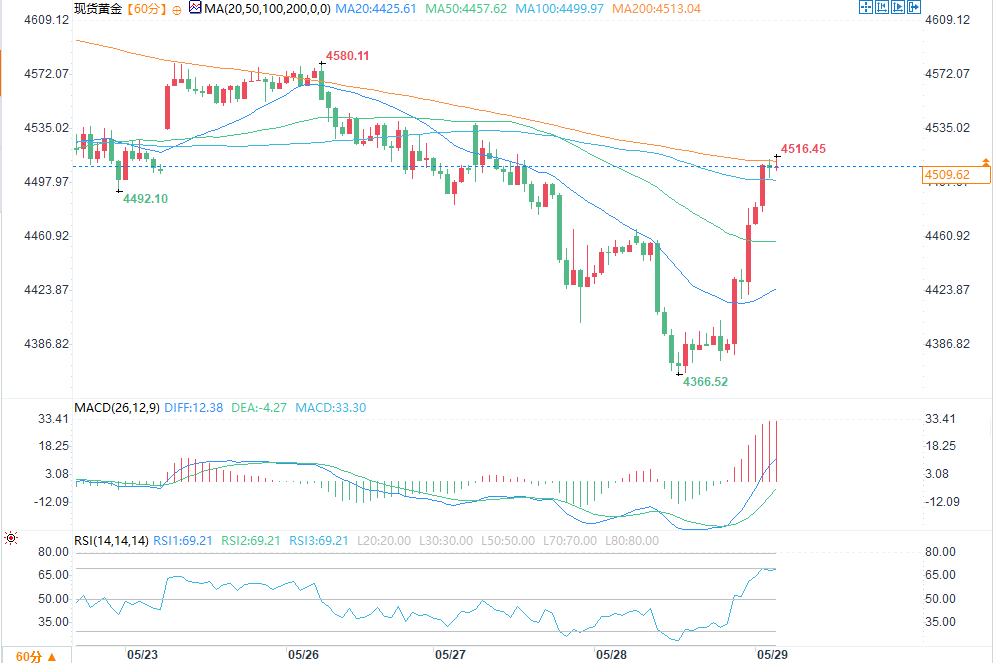
(Spot gold 1-hour chart source: EasyForex)
Having clarified the logic behind the rebound, we need to focus more on: where is the next key price level for gold? Where will the real battle between bulls and bears unfold?
On the support level below, the key support areas are located in the following regions:
The $4,357 to $4,399 range, which is the 200-day moving average area, is currently the most critical defensive position. A decisive break below this level would severely damage market sentiment, and the risk of testing $4,131 (the previous important low) would rise rapidly. The $4,000 psychological support level is significant, and it is also the trigger line for a "bear market scenario" set by some institutions. State Street and other institutions pointed out in their May gold monthly report that if oil prices remain at a high level of $120 to $140 for an extended period, this level may be tested.
Regarding the resistance level above, the bulls need to break through the following levels one by one:
$4,500 is a resistance level that has transformed from previous support and is also a recent area of high trading volume. Around $4,580, which coincides with the 20-day moving average, is a key level to verify the short-term trend. $4,645 is where the 50-day moving average is located, and it is also a core resistance level that has repeatedly "intercepted" gold prices since May. If this level can be recovered, it will be an important signal that the bulls have regained the initiative. And $5,000 is the medium-term target price that is generally recognized by institutions, and it is also a psychological sign of a full recovery in market confidence.
Bulls and bears: Institutional opinions are widely divergent.
The gold market is never short of debate, and the current disagreements among top institutions have reached an unprecedented level.
The bullish camp remains strong: Goldman Sachs maintains its year-end target price of $5,400; JPMorgan Chase predicts that gold prices could reach the $5,000 to $6,300 range by the end of 2026; Michael Hsueh, head of precious metals research at Deutsche Bank, raised his target price to $6,000; and Société Générale also set a year-end target of $6,000. Their core logic is that the US fiscal deficit continues to widen (estimated at approximately $2 trillion in fiscal year 2026), the sovereign debt problem remains unresolved, the central bank's reserve increase trend remains unchanged (estimated quarterly gold purchases of approximately 190 tons in 2026), and geopolitical risks have not completely subsided. These structural factors will continue to support gold's value as the "ultimate safe-haven asset."
Those holding a bearish or cautious view also have their reasons: technical analysis platforms such as Action Forex point out that gold is trading below its 50-day and 100-day moving averages, and the medium-term trend remains bearish, with a systemic technical correction still needed time; some economists believe that as long as the Federal Reserve adheres to its policy path of "maintaining high interest rates for a longer period," persistently high real interest rates will continue to suppress the attractiveness of gold, a non-yielding asset; in addition, North American gold ETFs saw net outflows of over $12.7 billion in March, the highest in more than five years, indicating that rebuilding confidence among retail and institutional investors will not happen overnight.
Castle Securities' warning: The most overlooked risk scenario
Amid the tumultuous debate between bulls and bears, a research report from Citadel Securities offers a strikingly different and thought-provoking analytical perspective.
Citadel Securities believes that the current market's widespread concern about the narrative of "persistent high inflation" driven by energy shocks and geopolitical situations may be obscuring another scenario that most investors are overlooking—the possibility of rapid normalization.
Timeline Review: On February 28th, the joint US-Israel military action triggered a sharp escalation of tensions in the Middle East, disrupting the Strait of Hormuz, causing oil prices to break through $100, followed by a surge in March's CPI data to 3.3%, completely suppressing expectations of a Fed rate cut, a sharp correction in gold prices from historical highs, and a large-scale outflow of funds from ETFs. The entire market's pricing logic was built around the core assumption that "inflation will remain high for a long time."
However, Citadel Securities pointed out in its report that the market is currently becoming highly sensitive to "flow normalization" rather than continuing to price in flow acceleration. In other words, the market may have already priced in too many pessimistic factors in advance.
Imagine this scenario: if the US-Iran negotiations make substantial progress (in fact, Axios reported on May 28th the preliminary framework of a 60-day interim agreement), tensions in the Strait of Hormuz ease, oil prices fall back to the "normalization level" of $80 to $85, and energy-driven inflationary pressures dissipate—at this point, the 3.3% CPI jump this year would be redefined as a one-time shock, rather than a systemic deterioration in the inflation trend.
Once this narrative holds true, everything will return to the trajectory before February 28th: expectations of interest rate cuts will quickly return, real interest rates will decline accordingly, the dollar will come under pressure, ETF funds will flow back into gold, and institutional funds that withdrew in large quantities in March and April citing "high inflation" will be forced to reassess their holdings. At that time, gold's renewed push towards $5,000 or even higher will no longer be a distant prediction.
State Street's May gold report echoed this logic: in its baseline scenario, if oil prices normalize to the $80-$85 range, gold is expected to climb further towards the $5,000-$5,500 range, driven by three channels: Federal Reserve policy, real interest rates, and the dollar exchange rate.
This is precisely where the biggest "cognitive asymmetry" lies in the gold market today: the vast majority of people are pricing in "continued inflation," but few are preparing for "rapid normalization." And when the expectation gap corrects, it is often the moment when prices move most dramatically.
Conclusion
In summary, gold is currently at a delicate juncture where multiple narratives converge: the relatively weak PCE data and signals of macroeconomic cooling provide short-term support, the 200-day moving average forms the "last line of defense" in terms of technology, and the real determining factor for future trends will be the speed of geopolitical developments and the pace of repricing of expectations for Fed policies.
For investors, Citadel Securities' "rapid normalization" scenario deserves serious attention—not because it is certain to happen, but because the market has hardly priced it in, and if it does come true, the resulting upward momentum will exceed most people's expectations.
Of course, uncertainty always exists. If the situation in the Middle East spirals out of control again, oil prices could surge above $120, and the scenario of gold falling to $4,000 should not be underestimated.
The rapid rebound following this sharp decline was no accident. From fundamentals to technicals, multiple forces combined at the same time, igniting this fuse.
Looking back at the entire month of May, gold prices fell sharply from their all-time high of $5,589 (reached on January 29th). At the beginning of the month, it encountered resistance from the 50-day moving average near $4,774, and subsequently declined steadily. This drop has exceeded 10%, quite similar to the historic plunge in March 2026 triggered by escalating geopolitical tensions (a single-month drop of over 10%, the largest monthly decline since June 2013), indicating that oversold sentiment has been quietly accumulating in the market. Year-to-date, despite some correction, gold has still risen more than 34% from the $3,300 area a year ago, and the long-term bull market trend remains fundamentally unchanged.
PCE Data: The Core Catalyst for the Rebound
The most crucial trigger for this rebound is the Fed's favorite inflation indicator—the core PCE (Personal Consumption Expenditures Price Index).
The core PCE data released on May 28 showed a month-on-month increase of only 0.2%, significantly lower than the market expectation of 0.3% and a marked decline from the previous 0.4%. This data brought a sigh of relief to the market.
Previously, tensions in the Strait of Hormuz persisted due to the geopolitical and military conflict between the United States and Iran, causing oil prices to surge and the market widely expecting energy-driven inflation to rise again. Federal Reserve Vice Chairman Philip Jefferson, in a speech on the same day, acknowledged that rising oil prices were a "downside risk to growth" and a "potential driver of inflation," emphasizing the Fed's "firm commitment to restoring inflation to its 2% target."
However, the weaker-than-expected PCE data delivered a pleasant surprise to the market—inflationary pressures may not be as severe as anticipated. This directly lowered the US dollar index, boosted US Treasury bonds, and made gold, a non-yielding asset, a favorite among investors. From a market perspective, whenever core PCE falls short of expectations, market expectations for a Fed rate cut this year rise, and gold prices benefit accordingly; this time was no exception.
Multiple data points resonate, solidifying the foundation for a rebound.
The PCE is not fighting alone; multiple economic data released simultaneously have collectively provided fundamental support for the gold price rebound.
The second revision to Q1 GDP figures. The U.S. Commerce Department lowered its Q1 2026 GDP growth forecast from the initial 2.0% to 1.6%, below market expectations, reflecting a slowdown in both private inventory investment and consumer spending. The weaker-than-expected economic growth means the Federal Reserve has less need to maintain high interest rates, objectively leaving room for expectations of rate cuts, which is somewhat positive for gold.
Initial jobless claims. The number of initial jobless claims released at the same time rose, further supporting market expectations of a shift in Federal Reserve policy. Renowned economist Mark Zandi estimates the probability of a US recession within the next year at 40%, far higher than the historical average of 15%, leading to a resurgence in safe-haven demand.
Durable goods orders. April's durable goods orders data showed slight fluctuations, with overall concerns about the state of the manufacturing sector intensifying, further fueling the narrative of an economic slowdown.
The U.S. Census Bureau and the U.S. Department of Housing and Urban Development announced Thursday that new home sales fell 6.2% in April to a seasonally adjusted year-over-year rate of 622,000 units. This figure is lower than March's 663,000 units. The actual decline far exceeded expectations.
The US dollar index weakened. Following the release of the aforementioned data, the US dollar index came under pressure and fell. The negative correlation between gold and the US dollar meant that gold prices naturally benefited from a weaker dollar, providing additional upward momentum.
These sets of data all point to a very clear picture: the economy is cooling down, and the rebound in inflation may be milder than previously feared, giving gold bulls a rare chance to breathe.
Technical Analysis: The 200-day moving average forms a natural protective barrier.
Whether positive fundamentals can translate into a sustained rebound depends heavily on technical support. This rebound, in particular, has occurred at a crucial technical juncture: the 200-day simple moving average.
Currently, the 200-day moving average for spot gold is located in the area of approximately $4,357 to $4,399. The intraday low of $4,366 on May 28th precisely touched this key moving average before a strong rebound, making it a textbook example of established technical support.
From a technical analysis perspective, the 200-day moving average is a "watershed" for distinguishing between long-term bull and bear markets: when the price is above the moving average, the bulls are in control; when it falls below the moving average and closes below it, it often indicates a greater downside risk. On May 28, although the price briefly fell below this line during the day, it ultimately held this key position at the close, showing that the bulls had a strong willingness to defend the price at this level.
Meanwhile, looking at overbought and oversold indicators, the RSI (Relative Strength Index) has fallen to around 38-39, entering near oversold territory, and the CCI (Commodity Channel Index) has also issued an oversold signal, making a technical "oversold rebound" demand very clear. Combined with the triangle consolidation pattern formed by continuous price compression in May, technical analysts generally believe that a significant directional breakout is poised to occur.
Support and Resistance: Where is the Battleground in the Future?
(Spot gold 1-hour chart source: EasyForex)
Having clarified the logic behind the rebound, we need to focus more on: where is the next key price level for gold? Where will the real battle between bulls and bears unfold?
On the support level below, the key support areas are located in the following regions:
The $4,357 to $4,399 range, which is the 200-day moving average area, is currently the most critical defensive position. A decisive break below this level would severely damage market sentiment, and the risk of testing $4,131 (the previous important low) would rise rapidly. The $4,000 psychological support level is significant, and it is also the trigger line for a "bear market scenario" set by some institutions. State Street and other institutions pointed out in their May gold monthly report that if oil prices remain at a high level of $120 to $140 for an extended period, this level may be tested.
Regarding the resistance level above, the bulls need to break through the following levels one by one:
$4,500 is a resistance level that has transformed from previous support and is also a recent area of high trading volume. Around $4,580, which coincides with the 20-day moving average, is a key level to verify the short-term trend. $4,645 is where the 50-day moving average is located, and it is also a core resistance level that has repeatedly "intercepted" gold prices since May. If this level can be recovered, it will be an important signal that the bulls have regained the initiative. And $5,000 is the medium-term target price that is generally recognized by institutions, and it is also a psychological sign of a full recovery in market confidence.
Bulls and bears: Institutional opinions are widely divergent.
The gold market is never short of debate, and the current disagreements among top institutions have reached an unprecedented level.
The bullish camp remains strong: Goldman Sachs maintains its year-end target price of $5,400; JPMorgan Chase predicts that gold prices could reach the $5,000 to $6,300 range by the end of 2026; Michael Hsueh, head of precious metals research at Deutsche Bank, raised his target price to $6,000; and Société Générale also set a year-end target of $6,000. Their core logic is that the US fiscal deficit continues to widen (estimated at approximately $2 trillion in fiscal year 2026), the sovereign debt problem remains unresolved, the central bank's reserve increase trend remains unchanged (estimated quarterly gold purchases of approximately 190 tons in 2026), and geopolitical risks have not completely subsided. These structural factors will continue to support gold's value as the "ultimate safe-haven asset."
Those holding a bearish or cautious view also have their reasons: technical analysis platforms such as Action Forex point out that gold is trading below its 50-day and 100-day moving averages, and the medium-term trend remains bearish, with a systemic technical correction still needed time; some economists believe that as long as the Federal Reserve adheres to its policy path of "maintaining high interest rates for a longer period," persistently high real interest rates will continue to suppress the attractiveness of gold, a non-yielding asset; in addition, North American gold ETFs saw net outflows of over $12.7 billion in March, the highest in more than five years, indicating that rebuilding confidence among retail and institutional investors will not happen overnight.
Castle Securities' warning: The most overlooked risk scenario
Amid the tumultuous debate between bulls and bears, a research report from Citadel Securities offers a strikingly different and thought-provoking analytical perspective.
Citadel Securities believes that the current market's widespread concern about the narrative of "persistent high inflation" driven by energy shocks and geopolitical situations may be obscuring another scenario that most investors are overlooking—the possibility of rapid normalization.
Timeline Review: On February 28th, the joint US-Israel military action triggered a sharp escalation of tensions in the Middle East, disrupting the Strait of Hormuz, causing oil prices to break through $100, followed by a surge in March's CPI data to 3.3%, completely suppressing expectations of a Fed rate cut, a sharp correction in gold prices from historical highs, and a large-scale outflow of funds from ETFs. The entire market's pricing logic was built around the core assumption that "inflation will remain high for a long time."
However, Citadel Securities pointed out in its report that the market is currently becoming highly sensitive to "flow normalization" rather than continuing to price in flow acceleration. In other words, the market may have already priced in too many pessimistic factors in advance.
Imagine this scenario: if the US-Iran negotiations make substantial progress (in fact, Axios reported on May 28th the preliminary framework of a 60-day interim agreement), tensions in the Strait of Hormuz ease, oil prices fall back to the "normalization level" of $80 to $85, and energy-driven inflationary pressures dissipate—at this point, the 3.3% CPI jump this year would be redefined as a one-time shock, rather than a systemic deterioration in the inflation trend.
Once this narrative holds true, everything will return to the trajectory before February 28th: expectations of interest rate cuts will quickly return, real interest rates will decline accordingly, the dollar will come under pressure, ETF funds will flow back into gold, and institutional funds that withdrew in large quantities in March and April citing "high inflation" will be forced to reassess their holdings. At that time, gold's renewed push towards $5,000 or even higher will no longer be a distant prediction.
State Street's May gold report echoed this logic: in its baseline scenario, if oil prices normalize to the $80-$85 range, gold is expected to climb further towards the $5,000-$5,500 range, driven by three channels: Federal Reserve policy, real interest rates, and the dollar exchange rate.
This is precisely where the biggest "cognitive asymmetry" lies in the gold market today: the vast majority of people are pricing in "continued inflation," but few are preparing for "rapid normalization." And when the expectation gap corrects, it is often the moment when prices move most dramatically.
Conclusion
In summary, gold is currently at a delicate juncture where multiple narratives converge: the relatively weak PCE data and signals of macroeconomic cooling provide short-term support, the 200-day moving average forms the "last line of defense" in terms of technology, and the real determining factor for future trends will be the speed of geopolitical developments and the pace of repricing of expectations for Fed policies.
For investors, Citadel Securities' "rapid normalization" scenario deserves serious attention—not because it is certain to happen, but because the market has hardly priced it in, and if it does come true, the resulting upward momentum will exceed most people's expectations.
Of course, uncertainty always exists. If the situation in the Middle East spirals out of control again, oil prices could surge above $120, and the scenario of gold falling to $4,000 should not be underestimated.
- Risk Warning and Disclaimer
- The market involves risk, and trading may not be suitable for all investors. This article is for reference only and does not constitute personal investment advice, nor does it take into account certain users’ specific investment objectives, financial situation, or other needs. Any investment decisions made based on this information are at your own risk.