It's not just the Federal Reserve! The hidden driver of yield growth: Tech giants have issued $250 billion in bonds this year.
2026-06-03 19:18:22
On Wednesday (June 3), US Treasury yields saw a modest rebound. The 2-year yield was 4.075%, and the 10-year yield was 4.480%, both recovering from their lows at the end of May and currently trading above the middle Bollinger Band and near the upper band. Crude oil prices rose by about $2.50 to around $96.30 due to renewed tensions in the Middle East, putting some pressure on non-energy assets, and US Treasury futures fell slightly. The US dollar index rebounded to around 99.35, while gold came under pressure. This movement reflects the complex market reaction to the combined effects of energy price volatility and long-term financing needs related to AI. Short-term bullish momentum has emerged, but the strength remains relatively mild. Overall, the yield curve has flattened slightly, and traders need to pay attention to subsequent data to further calibrate policy expectations.

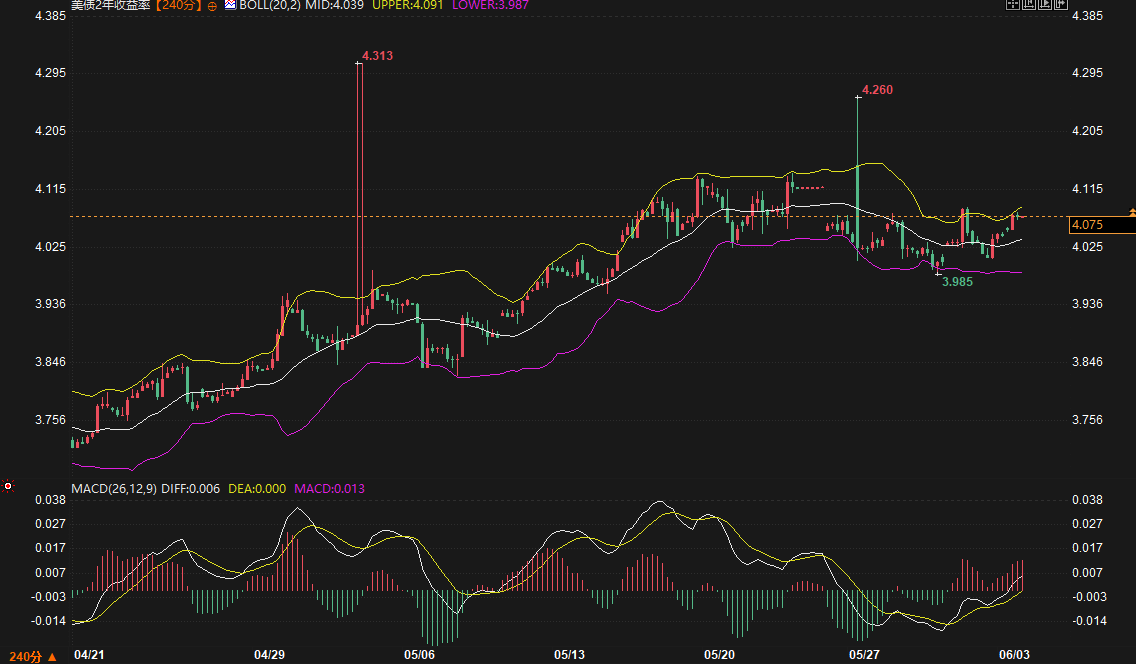
Observing the 240-minute chart, the 2-year yield is currently above the Bollinger Band middle line at 4.039, close to the upper line at 4.091, indicating a short-term bullish trend. In the MACD indicator, the DIFF line at 0.006 crossed above the DEA line at 0.000, and the histogram turned positive at 0.013, indicating that bullish momentum is beginning to take the lead. However, the histogram size is limited, suggesting that the rebound momentum has not yet reached a strong level. Since mid-May, the yield for this maturity has experienced wide fluctuations, reaching highs of 4.313 and 4.260 before falling back to a low of 3.985. The current rebound has returned above the middle line.
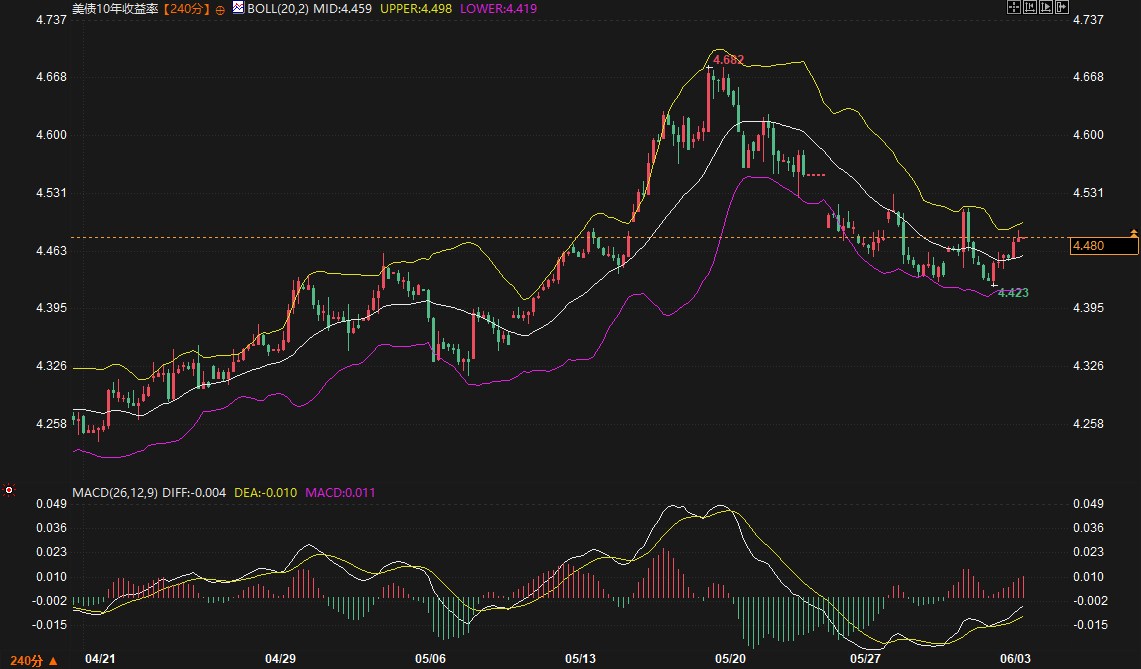
The 10-year yield showed a similar performance, at 4.480, also above the Bollinger Middle Band at 4.459 and close to the Upper Band at 4.498. On the MACD front, while the DIFF line at -0.004 remains negative, it is now above the DEA line at -0.010, and the red bars have slightly expanded to 0.011, indicating that bearish momentum is gradually weakening and bullish strength is gradually accumulating. After the upward trend from late April to mid-May, this term entered a correction phase, reaching a low of 4.423. The current rebound confirms the effectiveness of the Middle Band as short-term support.
Data shows that yields for both maturities have simultaneously risen above the Bollinger Middle Band, indicating a consistent bullish recovery signal from a technical perspective. However, the proximity to the Upper Band also suggests potential profit-taking pressure if a decisive breakout fails. The 2-year MACD's DIFF line has fully turned positive, indicating a relatively stronger short-term rebound; this difference warrants continued monitoring.
The AI infrastructure construction boom is having a significant spillover effect on the US Treasury market. According to reports from well-known foreign media outlets, tech giants such as Meta and Oracle have raised approximately $250 billion in the global bond market this year for the construction of data centers, power systems, and computing power. This scale would have been unimaginable a few years ago, and the actual financing needs may have been underestimated due to regulatory constraints.
Analysts point out that AI-related capital expenditures are projected to reach $750 billion to $850 billion annually, potentially approaching $1 trillion next year—a scale comparable to previous federal stimulus or infrastructure programs. The financing needs for these long-term assets are driving companies to favor locking in long-term fixed-rate bonds, directly increasing the supply of duration in the market. Research from the Dallas Federal Reserve shows that AI-related bond issuances provide approximately 15% of the duration supply of US Treasury bonds, a proportion that has a sustained impact on bond valuations.
Although yields have retreated from their May highs, they remain above levels seen at the beginning of the year, partly due to the interplay between the corporate borrowing boom and inflation expectations. In the long term, this structural financing demand could alter investors' assessment of supply pressures on U.S. Treasuries, especially given the continued stable demand for duration-based assets from long-term institutional investors such as insurance companies.
Recent developments in the Middle East have directly supported oil prices, which in turn have impacted interest rate expectations. The rebound in oil prices has increased inflation risks, and the market has begun to adjust its pricing for the Federal Reserve to maintain higher interest rates for a longer period. The CME FedWatch tool shows that the probability of a 25 basis point rate hike in December is currently around 42%. Officials at the Cleveland Fed have also previously stated that if inflationary pressures persist, the central bank may need to take action sooner rather than later.
This backdrop, combined with the demand for AI financing, has created a composite driving force for rising yields. The stronger rebound in short-term yields may reflect market expectations of a slight adjustment in the Fed's recent policy path, while long-term yields are more influenced by long-term supply and growth expectations. Data shows that term spreads are exhibiting some flattening, indicating that the market is weighing the balance between short-term tightening risks and long-term growth potential.
Cross-market observations show that the slight strengthening of the US dollar and the pressure on gold are both in line with rising oil prices and changes in interest rate expectations. The upcoming non-farm payroll data will provide clearer guidance for subsequent policy paths, allowing traders to assess the sustainability of the yield rebound.
The synchronized rebound in 2-year and 10-year yields reflects the internal coordination within the US Treasury market, but a stronger MACD signal at the short end suggests that monetary policy expectations remain one of the dominant variables. The corporate bond issuance boom primarily affects long-term duration, while energy price fluctuations affect both ends of the curve through the inflation channel.
Logically, when oil prices remain high and AI capital expenditures continue at an unabated pace, yields are likely to find temporary support; conversely, if geopolitical tensions ease or economic data slows, downward pressure will reappear. Current Bollinger Band positions suggest that around 4.091 is a short-term resistance level for the 2-year period, around 4.498 is a corresponding resistance level for the 10-year period, while the middle band area provides initial support. A break above the upper band or a confirmation of a pullback below the middle band will be a key technical signal for determining whether the rebound will continue or end.
Considering both technical and fundamental factors, US Treasury yields are likely to maintain a slightly bullish and volatile pattern in the short term, provided that oil prices remain firm and the AI financing narrative continues to gain traction. The 2-year yield may test its upper resistance level first, while the 10-year yield's rebound may be relatively mild; a positive DIFF line will be a key indicator to watch. If subsequent non-farm payroll data is stronger than expected, the upside potential for yields may further expand; conversely, if the data is moderate, profit-taking may occur, pushing yields back towards the middle band.
In the medium to long term, AI-driven structural supply increases will provide a floor for yields, but the specific level will depend on the actual pace of the Fed's policy response to inflation and the evolution of the global growth environment. Overall, the market is in a sensitive equilibrium period with multiple intertwined factors, requiring close monitoring of changes in energy prices, geopolitical dynamics, and employment data to dynamically adjust judgments on term spreads and absolute yield levels. At this stage, observation is more appropriate than preconceived positions; any directional breakout requires confirmation from multi-dimensional signals before it can be considered a trend signal.
Q1: What are the similarities and differences in the technical signals of the current 2-year and 10-year yields?
Both are within the upper Bollinger Band range, and the MACD histogram has already appeared, indicating a short-term synchronized rebound. However, the 2-year DIFF has turned completely positive, indicating stronger short-term momentum, while the 10-year DIFF remains negative, suggesting that long-term bullish forces are still brewing. This difference reflects that the short-term is more sensitive to policy expectations.
Q2: How does AI capital expenditure affect US Treasury yields?
The construction of AI infrastructure has driven tech companies to issue long-term bonds on a large scale, increasing the supply of duration bonds in the market, with annual capital expenditures expected to reach $750 billion to $850 billion. This structural demand is considered one of the important factors pushing up long-term yields, and together with inflation concerns, it has changed investors' traditional assessment of supply pressures.
Q3: What impact does rising oil prices have on yield trends?
Oil prices rebounded due to heightened inflation risks caused by the Middle East turmoil, increasing market expectations for higher interest rates to persist for a longer period. This transmission mechanism resonated with the demand for AI financing, providing temporary support for yields. Simultaneously, it led to a stronger dollar and pressure on gold, creating a cross-asset linkage effect.
Q4: What does the upper Bollinger Band mean for the current market situation?
The current price is approaching the upper Bollinger Band. A successful breakout could open up further upside potential; however, a pullback would increase the risk of the rebound ending. The middle Bollinger Band area, serving as a consolidation platform after the previous low, is a crucial reference point for determining the continuation of the trend.
Q5: What data and events should we focus on going forward?
Non-farm payroll data will be a key indicator this week, directly impacting the pricing of interest rate hike probabilities. In addition, oil price movements, geopolitical developments, and further corporate bond issuance will continue to shape yield trading ranges. Traders should maintain a dynamic observation of the interactions among these factors to form a complete market picture.
Short-term technical signals: Bollinger Band position and MACD momentum
Observing the 240-minute chart, the 2-year yield is currently above the Bollinger Band middle line at 4.039, close to the upper line at 4.091, indicating a short-term bullish trend. In the MACD indicator, the DIFF line at 0.006 crossed above the DEA line at 0.000, and the histogram turned positive at 0.013, indicating that bullish momentum is beginning to take the lead. However, the histogram size is limited, suggesting that the rebound momentum has not yet reached a strong level. Since mid-May, the yield for this maturity has experienced wide fluctuations, reaching highs of 4.313 and 4.260 before falling back to a low of 3.985. The current rebound has returned above the middle line.
The 10-year yield showed a similar performance, at 4.480, also above the Bollinger Middle Band at 4.459 and close to the Upper Band at 4.498. On the MACD front, while the DIFF line at -0.004 remains negative, it is now above the DEA line at -0.010, and the red bars have slightly expanded to 0.011, indicating that bearish momentum is gradually weakening and bullish strength is gradually accumulating. After the upward trend from late April to mid-May, this term entered a correction phase, reaching a low of 4.423. The current rebound confirms the effectiveness of the Middle Band as short-term support.
Data shows that yields for both maturities have simultaneously risen above the Bollinger Middle Band, indicating a consistent bullish recovery signal from a technical perspective. However, the proximity to the Upper Band also suggests potential profit-taking pressure if a decisive breakout fails. The 2-year MACD's DIFF line has fully turned positive, indicating a relatively stronger short-term rebound; this difference warrants continued monitoring.
Fundamental Drivers: AI Capital Expenditure and Long-Term Financing Supply
The AI infrastructure construction boom is having a significant spillover effect on the US Treasury market. According to reports from well-known foreign media outlets, tech giants such as Meta and Oracle have raised approximately $250 billion in the global bond market this year for the construction of data centers, power systems, and computing power. This scale would have been unimaginable a few years ago, and the actual financing needs may have been underestimated due to regulatory constraints.
Analysts point out that AI-related capital expenditures are projected to reach $750 billion to $850 billion annually, potentially approaching $1 trillion next year—a scale comparable to previous federal stimulus or infrastructure programs. The financing needs for these long-term assets are driving companies to favor locking in long-term fixed-rate bonds, directly increasing the supply of duration in the market. Research from the Dallas Federal Reserve shows that AI-related bond issuances provide approximately 15% of the duration supply of US Treasury bonds, a proportion that has a sustained impact on bond valuations.
Although yields have retreated from their May highs, they remain above levels seen at the beginning of the year, partly due to the interplay between the corporate borrowing boom and inflation expectations. In the long term, this structural financing demand could alter investors' assessment of supply pressures on U.S. Treasuries, especially given the continued stable demand for duration-based assets from long-term institutional investors such as insurance companies.
Interaction between energy prices and policy expectations
Recent developments in the Middle East have directly supported oil prices, which in turn have impacted interest rate expectations. The rebound in oil prices has increased inflation risks, and the market has begun to adjust its pricing for the Federal Reserve to maintain higher interest rates for a longer period. The CME FedWatch tool shows that the probability of a 25 basis point rate hike in December is currently around 42%. Officials at the Cleveland Fed have also previously stated that if inflationary pressures persist, the central bank may need to take action sooner rather than later.
This backdrop, combined with the demand for AI financing, has created a composite driving force for rising yields. The stronger rebound in short-term yields may reflect market expectations of a slight adjustment in the Fed's recent policy path, while long-term yields are more influenced by long-term supply and growth expectations. Data shows that term spreads are exhibiting some flattening, indicating that the market is weighing the balance between short-term tightening risks and long-term growth potential.
Cross-market observations show that the slight strengthening of the US dollar and the pressure on gold are both in line with rising oil prices and changes in interest rate expectations. The upcoming non-farm payroll data will provide clearer guidance for subsequent policy paths, allowing traders to assess the sustainability of the yield rebound.
Term structure and cross-market linkage logic
The synchronized rebound in 2-year and 10-year yields reflects the internal coordination within the US Treasury market, but a stronger MACD signal at the short end suggests that monetary policy expectations remain one of the dominant variables. The corporate bond issuance boom primarily affects long-term duration, while energy price fluctuations affect both ends of the curve through the inflation channel.
Logically, when oil prices remain high and AI capital expenditures continue at an unabated pace, yields are likely to find temporary support; conversely, if geopolitical tensions ease or economic data slows, downward pressure will reappear. Current Bollinger Band positions suggest that around 4.091 is a short-term resistance level for the 2-year period, around 4.498 is a corresponding resistance level for the 10-year period, while the middle band area provides initial support. A break above the upper band or a confirmation of a pullback below the middle band will be a key technical signal for determining whether the rebound will continue or end.
Trend Outlook
Considering both technical and fundamental factors, US Treasury yields are likely to maintain a slightly bullish and volatile pattern in the short term, provided that oil prices remain firm and the AI financing narrative continues to gain traction. The 2-year yield may test its upper resistance level first, while the 10-year yield's rebound may be relatively mild; a positive DIFF line will be a key indicator to watch. If subsequent non-farm payroll data is stronger than expected, the upside potential for yields may further expand; conversely, if the data is moderate, profit-taking may occur, pushing yields back towards the middle band.
In the medium to long term, AI-driven structural supply increases will provide a floor for yields, but the specific level will depend on the actual pace of the Fed's policy response to inflation and the evolution of the global growth environment. Overall, the market is in a sensitive equilibrium period with multiple intertwined factors, requiring close monitoring of changes in energy prices, geopolitical dynamics, and employment data to dynamically adjust judgments on term spreads and absolute yield levels. At this stage, observation is more appropriate than preconceived positions; any directional breakout requires confirmation from multi-dimensional signals before it can be considered a trend signal.
Frequently Asked Questions
Q1: What are the similarities and differences in the technical signals of the current 2-year and 10-year yields?
Both are within the upper Bollinger Band range, and the MACD histogram has already appeared, indicating a short-term synchronized rebound. However, the 2-year DIFF has turned completely positive, indicating stronger short-term momentum, while the 10-year DIFF remains negative, suggesting that long-term bullish forces are still brewing. This difference reflects that the short-term is more sensitive to policy expectations.
Q2: How does AI capital expenditure affect US Treasury yields?
The construction of AI infrastructure has driven tech companies to issue long-term bonds on a large scale, increasing the supply of duration bonds in the market, with annual capital expenditures expected to reach $750 billion to $850 billion. This structural demand is considered one of the important factors pushing up long-term yields, and together with inflation concerns, it has changed investors' traditional assessment of supply pressures.
Q3: What impact does rising oil prices have on yield trends?
Oil prices rebounded due to heightened inflation risks caused by the Middle East turmoil, increasing market expectations for higher interest rates to persist for a longer period. This transmission mechanism resonated with the demand for AI financing, providing temporary support for yields. Simultaneously, it led to a stronger dollar and pressure on gold, creating a cross-asset linkage effect.
Q4: What does the upper Bollinger Band mean for the current market situation?
The current price is approaching the upper Bollinger Band. A successful breakout could open up further upside potential; however, a pullback would increase the risk of the rebound ending. The middle Bollinger Band area, serving as a consolidation platform after the previous low, is a crucial reference point for determining the continuation of the trend.
Q5: What data and events should we focus on going forward?
Non-farm payroll data will be a key indicator this week, directly impacting the pricing of interest rate hike probabilities. In addition, oil price movements, geopolitical developments, and further corporate bond issuance will continue to shape yield trading ranges. Traders should maintain a dynamic observation of the interactions among these factors to form a complete market picture.
- Risk Warning and Disclaimer
- The market involves risk, and trading may not be suitable for all investors. This article is for reference only and does not constitute personal investment advice, nor does it take into account certain users’ specific investment objectives, financial situation, or other needs. Any investment decisions made based on this information are at your own risk.