USD/CAD Market Outlook: Tariff Concerns Resurface, Weakening the Canadian Dollar
2026-06-04 01:42:09
This round of buying spree initially stemmed from the unpredictable geopolitical situation in the Middle East, which helped the US dollar stabilize. Today's trading saw further news of potential new US tariffs, further boosting the dollar. If these uncertainties continue to escalate, the bullish buying in the USD/CAD pair may persist.
Is the shadow of tariffs looming again?
The statements released by the US government have suddenly increased short-term market uncertainty: the US plans to impose tariffs on 16 economies around the world, with a base tariff rate of at least 10%, including Canada, the UK, and the EU; the US is even considering a higher tariff of 12.5% on countries such as China and Japan.
The proposed tariffs will not be implemented immediately, but they have reignited market concerns about a trade war, potentially creating a repeat of the widespread trade frictions of 2025. The US will hold hearings in the coming weeks to finalize the details. While Canada has a buffer—goods compliant with the USMCA are exempt from the new tariffs—this cannot completely eliminate global trade uncertainty, and the potential for bilateral trade friction between the US and Canada remains.
The uncertainty surrounding the Middle East conflict has already created demand for safe-haven assets, supporting the US dollar. Now, renewed expectations of trade tensions further solidify the dollar's safe-haven status. During periods of frequent geopolitical conflicts and trade frictions, the US dollar has always been the preferred safe-haven currency for global funds.
Stimulated by tariff news, the US Dollar Index (DXY), which measures the strength of a basket of currencies, has stabilized above 99.5 and is approaching the key psychological level of 100. Short-term moving averages are steadily rising, directly reflecting a clear recovery in global funds' willingness to increase their holdings of US dollars.
In summary, the resurgence of trade friction risks is one of the core drivers of the US dollar's strength, directly suppressing the Canadian dollar's short-term rebound potential. If the market's risk aversion and uncertainty persist, the bullish trend in USD/CAD is likely to continue.
Divergence in US and Canadian bond yields continues to benefit the US dollar.
In recent trading days, the trends of US and Canadian government bonds have been similar, with the 10-year Treasury yields rising in tandem: the Canadian 10-year yield rose 0.88% in a single day, while the US 10-year Treasury yield rose 1.17% in a single day.
However, the absolute difference in yields is significant: the yield on 10-year US Treasury bonds remains close to 4.5%, while the yield on Canadian government bonds of the same maturity is only around 3.5%. Even if both countries' bond markets recover simultaneously, US Treasuries will still maintain a significant yield advantage in the fixed-income market.
High US Treasury yields will continue to attract global cross-border capital inflows into dollar-denominated bonds, fueling demand for foreign exchange and fundamentally supporting the dollar. Conversely, low Canadian bond yields make the assets less attractive. Historically, the US-Canada interest rate differential has repeatedly boosted the USD/CAD exchange rate, and as long as this differential pattern remains unchanged, this factor will continue to provide support for the USD/CAD exchange rate.
Technical Analysis
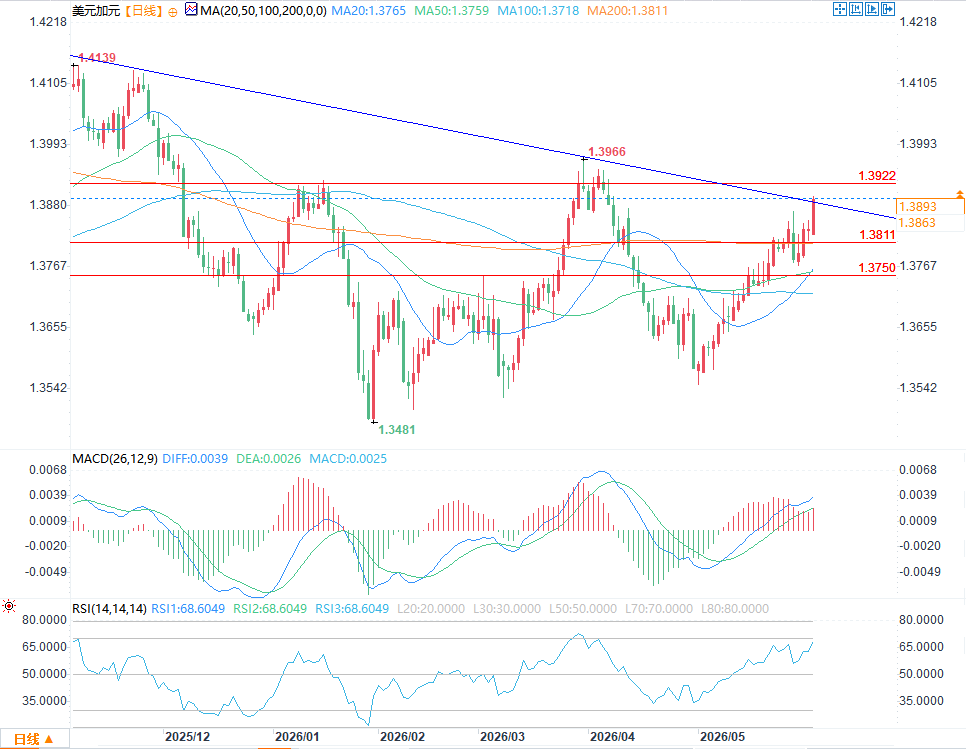
(USD/CAD daily chart source: EasyForex)
The long-term downtrend is facing a breakdown test: the long-term downtrend line on the daily chart, which has lasted for several months, has recently been continuously challenged by price rebounds. If bullish buying continues steadily, the original bearish trend will become invalid, and the market may completely shift to a bullish-dominated direction.
Relative Strength Index (RSI): The indicator has remained firmly above the 50 level, the dividing line between bullish and bearish trends. Over the past 14 periods, the overall bullish momentum has been dominant, and the medium-term bullish trend remains unchanged. However, the current RSI is approaching the 70 overbought threshold, indicating that the short-term bullish momentum is showing signs of exhaustion, and there is a possibility of a slight pullback and correction in the market.
Moving Average Convergence Divergence (MACD): The histogram continues to run above the zero axis, and the short-term moving averages maintain a bullish alignment, indicating that the medium-term trend remains favorable for USD/CAD.
Key price reference
Resistance level at 1.3922: A key high point located above the 50-day and 200-day moving averages. If the price steadily rises to this level and breaks through it effectively, it will break through the long-term downtrend line and open up new upside potential in the medium term.
The short-term resistance/support level is 1.3811: This level coincides with the 200-day moving average. If the market starts to decline in the short term, this level will become the first target tested by the bears.
Key support level at 1.3750: close to the 50-day moving average. A decisive break below this level would signal a return to a bearish trend, with the existing long-term downtrend resuming its dominance for the next few weeks.
Is the shadow of tariffs looming again?
The statements released by the US government have suddenly increased short-term market uncertainty: the US plans to impose tariffs on 16 economies around the world, with a base tariff rate of at least 10%, including Canada, the UK, and the EU; the US is even considering a higher tariff of 12.5% on countries such as China and Japan.
The proposed tariffs will not be implemented immediately, but they have reignited market concerns about a trade war, potentially creating a repeat of the widespread trade frictions of 2025. The US will hold hearings in the coming weeks to finalize the details. While Canada has a buffer—goods compliant with the USMCA are exempt from the new tariffs—this cannot completely eliminate global trade uncertainty, and the potential for bilateral trade friction between the US and Canada remains.
The uncertainty surrounding the Middle East conflict has already created demand for safe-haven assets, supporting the US dollar. Now, renewed expectations of trade tensions further solidify the dollar's safe-haven status. During periods of frequent geopolitical conflicts and trade frictions, the US dollar has always been the preferred safe-haven currency for global funds.
Stimulated by tariff news, the US Dollar Index (DXY), which measures the strength of a basket of currencies, has stabilized above 99.5 and is approaching the key psychological level of 100. Short-term moving averages are steadily rising, directly reflecting a clear recovery in global funds' willingness to increase their holdings of US dollars.
In summary, the resurgence of trade friction risks is one of the core drivers of the US dollar's strength, directly suppressing the Canadian dollar's short-term rebound potential. If the market's risk aversion and uncertainty persist, the bullish trend in USD/CAD is likely to continue.
Divergence in US and Canadian bond yields continues to benefit the US dollar.
In recent trading days, the trends of US and Canadian government bonds have been similar, with the 10-year Treasury yields rising in tandem: the Canadian 10-year yield rose 0.88% in a single day, while the US 10-year Treasury yield rose 1.17% in a single day.
However, the absolute difference in yields is significant: the yield on 10-year US Treasury bonds remains close to 4.5%, while the yield on Canadian government bonds of the same maturity is only around 3.5%. Even if both countries' bond markets recover simultaneously, US Treasuries will still maintain a significant yield advantage in the fixed-income market.
High US Treasury yields will continue to attract global cross-border capital inflows into dollar-denominated bonds, fueling demand for foreign exchange and fundamentally supporting the dollar. Conversely, low Canadian bond yields make the assets less attractive. Historically, the US-Canada interest rate differential has repeatedly boosted the USD/CAD exchange rate, and as long as this differential pattern remains unchanged, this factor will continue to provide support for the USD/CAD exchange rate.
Technical Analysis
(USD/CAD daily chart source: EasyForex)
The long-term downtrend is facing a breakdown test: the long-term downtrend line on the daily chart, which has lasted for several months, has recently been continuously challenged by price rebounds. If bullish buying continues steadily, the original bearish trend will become invalid, and the market may completely shift to a bullish-dominated direction.
Relative Strength Index (RSI): The indicator has remained firmly above the 50 level, the dividing line between bullish and bearish trends. Over the past 14 periods, the overall bullish momentum has been dominant, and the medium-term bullish trend remains unchanged. However, the current RSI is approaching the 70 overbought threshold, indicating that the short-term bullish momentum is showing signs of exhaustion, and there is a possibility of a slight pullback and correction in the market.
Moving Average Convergence Divergence (MACD): The histogram continues to run above the zero axis, and the short-term moving averages maintain a bullish alignment, indicating that the medium-term trend remains favorable for USD/CAD.
Key price reference
Resistance level at 1.3922: A key high point located above the 50-day and 200-day moving averages. If the price steadily rises to this level and breaks through it effectively, it will break through the long-term downtrend line and open up new upside potential in the medium term.
The short-term resistance/support level is 1.3811: This level coincides with the 200-day moving average. If the market starts to decline in the short term, this level will become the first target tested by the bears.
Key support level at 1.3750: close to the 50-day moving average. A decisive break below this level would signal a return to a bearish trend, with the existing long-term downtrend resuming its dominance for the next few weeks.
- Risk Warning and Disclaimer
- The market involves risk, and trading may not be suitable for all investors. This article is for reference only and does not constitute personal investment advice, nor does it take into account certain users’ specific investment objectives, financial situation, or other needs. Any investment decisions made based on this information are at your own risk.