Crude oil trading alert: Recurring geopolitical tensions and supply concerns are supporting oil prices; prices are likely to remain range-bound in the short term.
2026-06-04 09:55:32
On Thursday during Asian trading hours, US crude oil prices remained range-bound, trading around $95. The global energy market is undergoing one of the most severe supply tests in recent years. As the US-Iran conflict continues to escalate, Middle Eastern oil shipments are severely impacted, while the US, which plays a crucial role in regulating global energy supply, is experiencing a rapid decline in inventory levels. Latest data shows that US crude oil and petroleum product inventories have fallen to their lowest level in over two decades, a development that is triggering widespread concerns about global energy security.

Data released by the U.S. Energy Information Administration (EIA) showed that total U.S. crude oil and petroleum product inventories fell by 10.6 million barrels to approximately 1.57 billion barrels in the week ending May 29, the lowest level since 2004. At the same time, U.S. commercial crude oil inventories fell by 8 million barrels to 433.7 million barrels, marking the sixth consecutive week of declines and far exceeding market expectations of a 3.3 million barrel drop.
The rapid decline in inventories was primarily driven by surging export demand. Disruptions to supply chains in the Middle East led Asian and European buyers to turn to the US market for crude oil, pushing US exports to record highs. Data shows that in the week ending May 29, US crude oil exports reached a staggering 5.9 million barrels per day, an increase of approximately 1.4 million barrels per day from the previous week. This figure not only broke historical records but also exceeded the daily production levels of several major oil-producing countries. Previously, throughout May, the average US crude oil exports had reached approximately 5.6 million barrels per day. In terms of export structure, the Asian market became the largest buyer, importing 2.45 million barrels per day; Europe followed closely behind, importing 2.4 million barrels per day, both setting new historical highs.
Japan's crude oil imports from the United States reached 808,000 barrels per day in May, an increase of approximately 32% month-on-month. Meanwhile, European countries such as Italy, Greece, Croatia, Bulgaria, and Turkey also significantly increased their purchases of US crude oil. One of the key reasons driving this surge in exports is the change in the international crude oil price structure. In March of this year, the discount of US WTI crude oil to Brent crude oil widened to $20.69 per barrel, the largest gap in nearly 13 years. For refineries in Asia and Europe, US crude oil has become a highly attractive alternative source of supply.
Meanwhile, the US domestic refining system is also operating at high capacity. As of the latest statistical period, the US refinery utilization rate has risen to 94.7%, nearing full capacity. Increased exports and rising domestic consumption are further accelerating inventory depletion. It is worth noting that the US Strategic Petroleum Reserve (SPR) is also in a continuous decline. The Trump administration previously approved the release of approximately 172 million barrels of strategic reserve crude oil to alleviate upward pressure on energy prices. To date, approximately 50 million barrels have been released, reducing the strategic reserve to approximately 357.1 million barrels. With both commercial inventories and strategic reserves declining simultaneously, the market is beginning to question whether the US still possesses the ability to sustainably stabilize the global energy market.
Market concerns are gradually shifting from supply issues to price issues. Analysts believe that once inventories fall to a certain level, the US will have to use higher oil prices to curb export demand, thus prioritizing domestic supply. However, as the WTI-Brent price spread narrows, the export boom may begin to cool. Data shows that the price difference has narrowed from over $20 in March to approximately $6 per barrel currently.
Energy Aspects projects that U.S. crude oil exports may fall to approximately 4.9 million barrels per day in June and further decline to approximately 4.6 million barrels per day in July. However, the decline in exports does not necessarily mean that supply pressures have eased. With inventories already at historically low levels, the U.S. market needs to prioritize replenishing its stocks, meaning that the additional supply available to the global market will be significantly reduced.
From a macroeconomic perspective, rising energy prices are forcing markets to reassess the policy paths of major central banks worldwide. As imported inflationary pressures from rising oil prices intensify, the Federal Reserve may extend its high-interest-rate policy, further increasing the risk of a global economic slowdown.
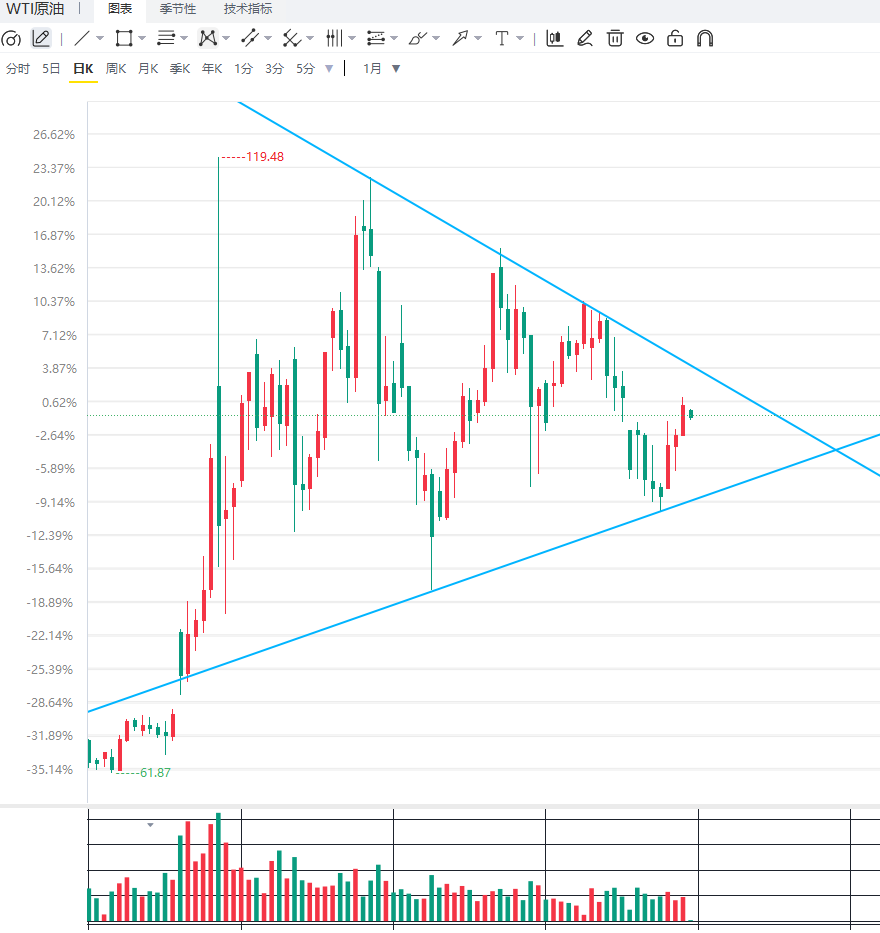
From a technical perspective, the daily chart for US crude oil maintains a converging and oscillating pattern, with prices hovering around key moving averages, indicating a continued tug-of-war between bulls and bears. As the trading range gradually narrows, the market is awaiting new fundamental factors to drive a directional move. The MACD indicator is hovering near the zero line with weakening momentum, suggesting an unclear short-term trend. The RSI indicator remains in neutral territory, reflecting relatively cautious market sentiment. Currently, the key resistance level to watch is around $98; if prices fail to hold above this level, a further pullback is possible. On the downside, the key support level to watch is around $90.
From a 4-hour chart perspective, oil prices continue their range-bound trading, with short-term rebound momentum slowing. The MACD indicator is converging, indicating a lack of clear directional guidance in the market. The RSI is hovering around 50, suggesting a relatively balanced balance between bullish and bearish forces. If prices can effectively break through and hold above $98, further upside potential is possible; conversely, if multiple attempts to break through fail and prices fall back, caution is warranted as prices may seek support around $90.
Editor's Summary : The continued decline in US energy inventories and record export growth reflect a severe supply-demand imbalance in the global energy market. With shipping disruptions in the Strait of Hormuz, the US has shouldered the crucial task of filling the global supply gap, but the continued depletion of inventories means this buffer mechanism is nearing its limit. The most critical issue in the market now is no longer whether supply is tight, but how long the US can sustain its supply compensation capacity.
Data released by the U.S. Energy Information Administration (EIA) showed that total U.S. crude oil and petroleum product inventories fell by 10.6 million barrels to approximately 1.57 billion barrels in the week ending May 29, the lowest level since 2004. At the same time, U.S. commercial crude oil inventories fell by 8 million barrels to 433.7 million barrels, marking the sixth consecutive week of declines and far exceeding market expectations of a 3.3 million barrel drop.
The rapid decline in inventories was primarily driven by surging export demand. Disruptions to supply chains in the Middle East led Asian and European buyers to turn to the US market for crude oil, pushing US exports to record highs. Data shows that in the week ending May 29, US crude oil exports reached a staggering 5.9 million barrels per day, an increase of approximately 1.4 million barrels per day from the previous week. This figure not only broke historical records but also exceeded the daily production levels of several major oil-producing countries. Previously, throughout May, the average US crude oil exports had reached approximately 5.6 million barrels per day. In terms of export structure, the Asian market became the largest buyer, importing 2.45 million barrels per day; Europe followed closely behind, importing 2.4 million barrels per day, both setting new historical highs.
Japan's crude oil imports from the United States reached 808,000 barrels per day in May, an increase of approximately 32% month-on-month. Meanwhile, European countries such as Italy, Greece, Croatia, Bulgaria, and Turkey also significantly increased their purchases of US crude oil. One of the key reasons driving this surge in exports is the change in the international crude oil price structure. In March of this year, the discount of US WTI crude oil to Brent crude oil widened to $20.69 per barrel, the largest gap in nearly 13 years. For refineries in Asia and Europe, US crude oil has become a highly attractive alternative source of supply.
Meanwhile, the US domestic refining system is also operating at high capacity. As of the latest statistical period, the US refinery utilization rate has risen to 94.7%, nearing full capacity. Increased exports and rising domestic consumption are further accelerating inventory depletion. It is worth noting that the US Strategic Petroleum Reserve (SPR) is also in a continuous decline. The Trump administration previously approved the release of approximately 172 million barrels of strategic reserve crude oil to alleviate upward pressure on energy prices. To date, approximately 50 million barrels have been released, reducing the strategic reserve to approximately 357.1 million barrels. With both commercial inventories and strategic reserves declining simultaneously, the market is beginning to question whether the US still possesses the ability to sustainably stabilize the global energy market.
Market concerns are gradually shifting from supply issues to price issues. Analysts believe that once inventories fall to a certain level, the US will have to use higher oil prices to curb export demand, thus prioritizing domestic supply. However, as the WTI-Brent price spread narrows, the export boom may begin to cool. Data shows that the price difference has narrowed from over $20 in March to approximately $6 per barrel currently.
Energy Aspects projects that U.S. crude oil exports may fall to approximately 4.9 million barrels per day in June and further decline to approximately 4.6 million barrels per day in July. However, the decline in exports does not necessarily mean that supply pressures have eased. With inventories already at historically low levels, the U.S. market needs to prioritize replenishing its stocks, meaning that the additional supply available to the global market will be significantly reduced.
From a macroeconomic perspective, rising energy prices are forcing markets to reassess the policy paths of major central banks worldwide. As imported inflationary pressures from rising oil prices intensify, the Federal Reserve may extend its high-interest-rate policy, further increasing the risk of a global economic slowdown.
From a technical perspective, the daily chart for US crude oil maintains a converging and oscillating pattern, with prices hovering around key moving averages, indicating a continued tug-of-war between bulls and bears. As the trading range gradually narrows, the market is awaiting new fundamental factors to drive a directional move. The MACD indicator is hovering near the zero line with weakening momentum, suggesting an unclear short-term trend. The RSI indicator remains in neutral territory, reflecting relatively cautious market sentiment. Currently, the key resistance level to watch is around $98; if prices fail to hold above this level, a further pullback is possible. On the downside, the key support level to watch is around $90.
From a 4-hour chart perspective, oil prices continue their range-bound trading, with short-term rebound momentum slowing. The MACD indicator is converging, indicating a lack of clear directional guidance in the market. The RSI is hovering around 50, suggesting a relatively balanced balance between bullish and bearish forces. If prices can effectively break through and hold above $98, further upside potential is possible; conversely, if multiple attempts to break through fail and prices fall back, caution is warranted as prices may seek support around $90.
Editor's Summary : The continued decline in US energy inventories and record export growth reflect a severe supply-demand imbalance in the global energy market. With shipping disruptions in the Strait of Hormuz, the US has shouldered the crucial task of filling the global supply gap, but the continued depletion of inventories means this buffer mechanism is nearing its limit. The most critical issue in the market now is no longer whether supply is tight, but how long the US can sustain its supply compensation capacity.
- Risk Warning and Disclaimer
- The market involves risk, and trading may not be suitable for all investors. This article is for reference only and does not constitute personal investment advice, nor does it take into account certain users’ specific investment objectives, financial situation, or other needs. Any investment decisions made based on this information are at your own risk.