Is the Bank of Japan about to implement its most aggressive interest rate hike in 30 years? The battle for the USD/JPY exchange rate around 160 has begun.
2026-06-04 20:08:41
On Thursday (June 4), the USD/JPY exchange rate hovered around the 159.7-160 range, continuing its recent high-level consolidation pattern. Early morning data showed the rate briefly approached the 160 mark, with market participants closely watching for potential currency intervention by the Japanese government and the upcoming policy meeting of the Bank of Japan.
The yield on Japan's 10-year government bonds remained high at around 2.67%, reflecting market pricing in inflationary pressures and policy normalization. Recent increases in energy costs related to the Middle East situation pushed Japan's wholesale price index up 4.9% year-on-year, the fastest pace in three years. This directly exacerbated import costs and amplified the impact of the yen's depreciation on domestic prices. The prevailing market view is that unless there are significant changes in the external environment, the Bank of Japan is highly likely to take action at its June 15-16 meeting.
The Bank of Japan's policy rate is currently at 0.75%, and the market expects it to be raised to 1% at this meeting, which would be the highest level in 30 years. Recent statements by Governor Kazuo Ueda indicate that the central bank is shifting towards a more proactive approach to managing inflation risks, and several members of the policy board have also expressed concern about price pressures. Accelerating wholesale price increases and rising energy costs provide data support for a tightening of monetary policy.
In the Japanese bond market, yields climbed to near 30-year highs, putting pressure on the central bank's bond-buying program. The current tapering schedule ends in March 2027, and the framework for fiscal year 2027 will be discussed during the meeting. The prevailing view leans towards pausing or slowing the pace of tapering to maintain bond market stability. This is linked to exchange rate dynamics: higher bond yields help narrow the USD/JPY interest rate differential, thus providing some support for the yen.
In May, Japan implemented a large-scale currency intervention, totaling 11.7 trillion yen, aimed at addressing excessive volatility. However, the intervention had limited effect, and the exchange rate quickly rebounded to its high levels. Finance Ministry officials have repeatedly emphasized that they will closely monitor market dynamics and take appropriate action if necessary. This constitutes an important policy buffer for the current exchange rate trend.
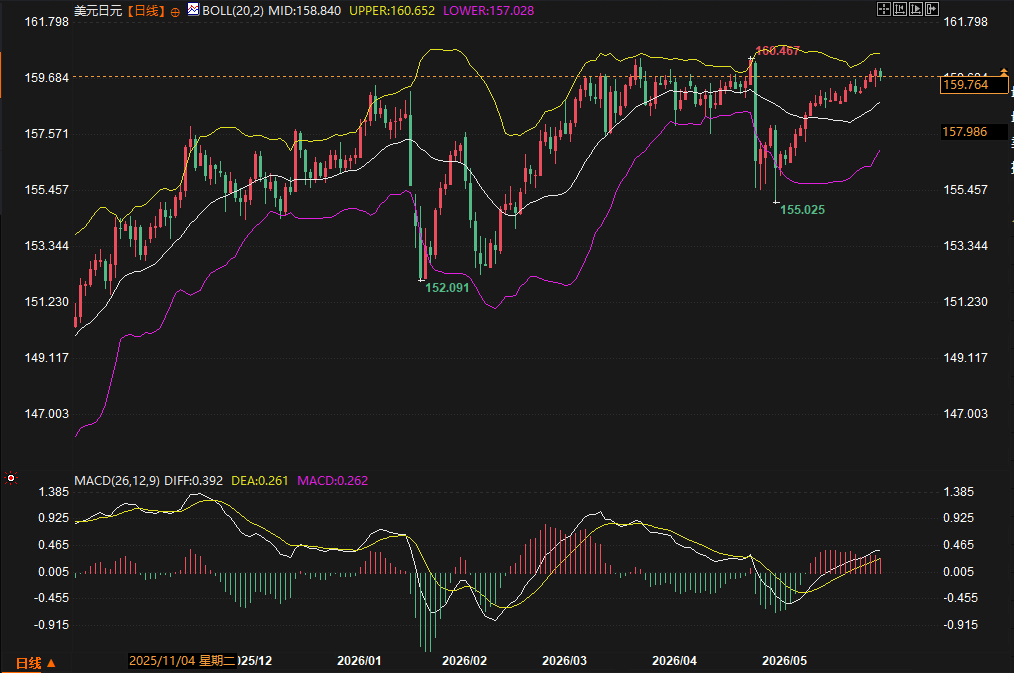
Technical and fundamental factors corroborate each other. The USD/JPY pair has been trending upwards in a volatile manner since November 2025. The May pullback low of 155.025 is higher than the January low of 152.091, forming a higher low and maintaining the overall upward trend. As long as the exchange rate holds key support levels, the medium-term direction remains unchanged.
The Bollinger Bands (20,2) indicator shows the upper band at 160.652, the middle band at 158.840, and the lower band at 157.028. The current price of 159.764 is between the middle and upper bands and close to the upper band, indicating increased volatility. The MACD (26,12,9) fast line is at 0.392, the slow line is at 0.261, and the histogram is positive at 0.262 and continues to turn red, indicating a stable bullish pattern. Historically, the MACD has turned green during pullbacks, but the current red histogram suggests that bearish momentum has been digested.
Key price levels:
- Strong resistance zone: 160.467-160.652, where the previous high coincides with the upper Bollinger Band.
- First support level: 158.840, with the Bollinger Middle Band serving as the dividing line between bullish and bearish sentiment in the medium term.
- Second support: 157.028, lower Bollinger Band.
- Trend support level: 155.025. A break below this level could alter the upward structure.
In the short term, the price is likely to test the resistance level of 160.467-160.652. A successful breakout could open up further upside potential; if it encounters resistance and falls back, the middle Bollinger Band will be the primary point of observation. During trading, close attention should be paid to the correlation between Japanese government bond yield fluctuations and the US dollar index, as both will influence the direction of the exchange rate breakout.
In the medium term, persistently high Japanese government bond yields will continue to test the Bank of Japan's ability to balance inflation and market stability. The outcome of the June meeting will be a key catalyst; if policy tightening is confirmed and accompanied by adjustments to the bond-buying program, the yen may receive temporary support. However, external energy price variables and the overall trend of the US dollar will continue to dominate the trading range. The exchange rate is expected to trade within a wide range of 155-162, with attention focused on the market's reaction after each policy signal. The overall upward trend remains intact, but caution is advised as it approaches resistance levels.
What direct impact does the current high yield on Japanese government bonds have on the USD/JPY exchange rate?
The persistently high yield on 10-year government bonds helps narrow the interest rate differential between the US and Japan, theoretically benefiting the yen. However, in practice, rising yields also reflect inflationary pressures, potentially reinforcing expectations of central bank rate hikes, thus creating dual support for the yen. It's necessary to observe the synchronicity between yields and exchange rates; if yields continue to rise while the exchange rate remains weak, it may indicate increased pressure for intervention.
What is the most likely action the Bank of Japan will take at its June meeting?
Based on market pricing, there is approximately an 80% probability of a 25 basis point rate hike to 1%. The meeting will also discuss the bond-buying framework for fiscal year 2027, with mainstream expectations leaning towards pausing or slowing the tapering to stabilize the bond market. These two measures, working together, could provide a policy boost to the yen.
How should the effects of the large-scale exchange rate intervention in May be assessed?
The intervention was of record scale, but the exchange rate quickly rebounded to pre-intervention levels, indicating that negative fundamental factors still dominate. The intervention mainly served a short-term purpose in curbing excessive volatility, and its long-term effectiveness depends on the pace of central bank policy normalization.
Where might the exchange rate go after the upper Bollinger Band is broken?
If the price effectively breaks above 160.652, it may accelerate its test of the 162 level or even higher in the short term. However, a breakout needs to be confirmed by trading volume; otherwise, a false breakout followed by a pullback to the middle Bollinger Band at 158.840 is possible. Pay attention to the performance of the US dollar index during the trading session.
What are the main risks facing the Japanese yen in the medium term?
Persistently high energy costs could prolong inflationary pressures, forcing central banks to take more aggressive action; conversely, if an easing external environment leads to a weaker dollar, the yen will have room to rebound. A key level to watch is whether the 155.025 low holds; a break below this level would challenge the upward trend structure.
The yield on Japan's 10-year government bonds remained high at around 2.67%, reflecting market pricing in inflationary pressures and policy normalization. Recent increases in energy costs related to the Middle East situation pushed Japan's wholesale price index up 4.9% year-on-year, the fastest pace in three years. This directly exacerbated import costs and amplified the impact of the yen's depreciation on domestic prices. The prevailing market view is that unless there are significant changes in the external environment, the Bank of Japan is highly likely to take action at its June 15-16 meeting.
Fundamental Drivers: Japanese Bond Prices and Potential Actions by the Bank of Japan
The Bank of Japan's policy rate is currently at 0.75%, and the market expects it to be raised to 1% at this meeting, which would be the highest level in 30 years. Recent statements by Governor Kazuo Ueda indicate that the central bank is shifting towards a more proactive approach to managing inflation risks, and several members of the policy board have also expressed concern about price pressures. Accelerating wholesale price increases and rising energy costs provide data support for a tightening of monetary policy.
In the Japanese bond market, yields climbed to near 30-year highs, putting pressure on the central bank's bond-buying program. The current tapering schedule ends in March 2027, and the framework for fiscal year 2027 will be discussed during the meeting. The prevailing view leans towards pausing or slowing the pace of tapering to maintain bond market stability. This is linked to exchange rate dynamics: higher bond yields help narrow the USD/JPY interest rate differential, thus providing some support for the yen.
In May, Japan implemented a large-scale currency intervention, totaling 11.7 trillion yen, aimed at addressing excessive volatility. However, the intervention had limited effect, and the exchange rate quickly rebounded to its high levels. Finance Ministry officials have repeatedly emphasized that they will closely monitor market dynamics and take appropriate action if necessary. This constitutes an important policy buffer for the current exchange rate trend.
Technical and fundamental factors corroborate each other. The USD/JPY pair has been trending upwards in a volatile manner since November 2025. The May pullback low of 155.025 is higher than the January low of 152.091, forming a higher low and maintaining the overall upward trend. As long as the exchange rate holds key support levels, the medium-term direction remains unchanged.
The Bollinger Bands (20,2) indicator shows the upper band at 160.652, the middle band at 158.840, and the lower band at 157.028. The current price of 159.764 is between the middle and upper bands and close to the upper band, indicating increased volatility. The MACD (26,12,9) fast line is at 0.392, the slow line is at 0.261, and the histogram is positive at 0.262 and continues to turn red, indicating a stable bullish pattern. Historically, the MACD has turned green during pullbacks, but the current red histogram suggests that bearish momentum has been digested.
Key price levels:
- Strong resistance zone: 160.467-160.652, where the previous high coincides with the upper Bollinger Band.
- First support level: 158.840, with the Bollinger Middle Band serving as the dividing line between bullish and bearish sentiment in the medium term.
- Second support: 157.028, lower Bollinger Band.
- Trend support level: 155.025. A break below this level could alter the upward structure.
In the short term, the price is likely to test the resistance level of 160.467-160.652. A successful breakout could open up further upside potential; if it encounters resistance and falls back, the middle Bollinger Band will be the primary point of observation. During trading, close attention should be paid to the correlation between Japanese government bond yield fluctuations and the US dollar index, as both will influence the direction of the exchange rate breakout.
Future Trend Outlook
In the medium term, persistently high Japanese government bond yields will continue to test the Bank of Japan's ability to balance inflation and market stability. The outcome of the June meeting will be a key catalyst; if policy tightening is confirmed and accompanied by adjustments to the bond-buying program, the yen may receive temporary support. However, external energy price variables and the overall trend of the US dollar will continue to dominate the trading range. The exchange rate is expected to trade within a wide range of 155-162, with attention focused on the market's reaction after each policy signal. The overall upward trend remains intact, but caution is advised as it approaches resistance levels.
Frequently Asked Questions
What direct impact does the current high yield on Japanese government bonds have on the USD/JPY exchange rate?
The persistently high yield on 10-year government bonds helps narrow the interest rate differential between the US and Japan, theoretically benefiting the yen. However, in practice, rising yields also reflect inflationary pressures, potentially reinforcing expectations of central bank rate hikes, thus creating dual support for the yen. It's necessary to observe the synchronicity between yields and exchange rates; if yields continue to rise while the exchange rate remains weak, it may indicate increased pressure for intervention.
What is the most likely action the Bank of Japan will take at its June meeting?
Based on market pricing, there is approximately an 80% probability of a 25 basis point rate hike to 1%. The meeting will also discuss the bond-buying framework for fiscal year 2027, with mainstream expectations leaning towards pausing or slowing the tapering to stabilize the bond market. These two measures, working together, could provide a policy boost to the yen.
How should the effects of the large-scale exchange rate intervention in May be assessed?
The intervention was of record scale, but the exchange rate quickly rebounded to pre-intervention levels, indicating that negative fundamental factors still dominate. The intervention mainly served a short-term purpose in curbing excessive volatility, and its long-term effectiveness depends on the pace of central bank policy normalization.
Where might the exchange rate go after the upper Bollinger Band is broken?
If the price effectively breaks above 160.652, it may accelerate its test of the 162 level or even higher in the short term. However, a breakout needs to be confirmed by trading volume; otherwise, a false breakout followed by a pullback to the middle Bollinger Band at 158.840 is possible. Pay attention to the performance of the US dollar index during the trading session.
What are the main risks facing the Japanese yen in the medium term?
Persistently high energy costs could prolong inflationary pressures, forcing central banks to take more aggressive action; conversely, if an easing external environment leads to a weaker dollar, the yen will have room to rebound. A key level to watch is whether the 155.025 low holds; a break below this level would challenge the upward trend structure.
- Risk Warning and Disclaimer
- The market involves risk, and trading may not be suitable for all investors. This article is for reference only and does not constitute personal investment advice, nor does it take into account certain users’ specific investment objectives, financial situation, or other needs. Any investment decisions made based on this information are at your own risk.