Silver Price Forecast: Rising Concerns Over Fed Rate Hikes Intensify Silver's Decline
2026-06-08 17:47:38
On Monday (June 8), spot silver was trading at $66.708 per ounce during the European session, down 1.71%. Currently, silver's upward momentum is weak, coupled with the risk of Federal Reserve policy changes, suggesting that prices may initially continue to correct before resuming their upward trend.
Strong US employment data has fueled market expectations that the Federal Reserve will maintain high interest rates for an extended period. Coupled with rising US Treasury yields and a stronger dollar, spot silver has remained under pressure, and precious metals as a whole have been negatively impacted. In my view, this price correction will create a significant new buying opportunity for long-term investors. This article will analyze the impact of various macroeconomic factors on the future price trend of silver, considering macroeconomic fundamentals, inflationary risks driven by oil prices, and divergent signals from the US Institute for Supply Management (ISM) manufacturing data, examining both short-term and long-term price movements.
Concerns about Fed rate hikes and oil price inflation are both weighing on silver prices.
Strong US employment data reignited market fears of a Federal Reserve rate hike, putting downward pressure on silver prices in the short term. Rising interest rates and a stronger dollar have weakened market demand for precious metals, causing both gold and silver to decline. However, compared to gold, silver has stronger industrial demand as a fundamental support.
Even with industrial demand providing some support, silver's decline in this round far exceeded that of gold, resulting in significant market volatility. Last week, gold fell by a cumulative 4.68%, while silver plummeted by 10.01%; on the day the US employment data was released, gold fell by 3.29% in a single day, while silver plunged by an even steeper 8.31%. The market's expectation that positive US labor data would prompt the Federal Reserve to restart interest rate hikes is the core reason for this round of sharp declines.
Oil price trends are also a key variable affecting silver. Renewed tensions in the Middle East have driven up oil prices, leading to rising inflation expectations and putting silver in a dilemma: in the long term, inflation benefits physical assets, but high inflation will force the Federal Reserve to maintain high interest rates for an extended period. This is the core logic behind the current inflationary environment, which suggests that silver will likely continue to decline in the short term.
The US ISM Manufacturing Purchasing Managers' Index (PMI) showed mixed results. Data showed that US manufacturing activity rebounded somewhat in May, with new orders also improving. Silver is widely used in electronics, photovoltaics, power facilities, and various industrial consumables; theoretically, a manufacturing recovery should boost industrial demand for silver.
However, the ISM price sub-index shows that business cost pressures remain high due to the impact of oil derivatives, tariffs, and steel and aluminum product prices. While manufacturing demand is recovering, persistently high inflation risks have further strengthened market expectations of a tighter monetary policy from the Federal Reserve, continuing to put downward pressure on silver prices.
Review of this round of silver price correction
As previously analyzed, silver has entered a clear short-term correction cycle. It was previously predicted that after breaking below the $70 mark, silver prices would further decline to the $50-$60 range, an area expected to attract significant buying interest. Now, with silver prices falling continuously, market volatility increasing, and short-term upward momentum lacking, the importance of this support level is becoming increasingly apparent.
However, the short-term pullback has not changed the overall bullish trend for silver. This long-term bull market is supported by multiple positive factors: silver prices breaking through previous resistance levels, market supply shortages, steady growth in industrial demand, and incremental demand from new energy and artificial intelligence infrastructure construction. Silver prices may still have room to fall in the short term, but once they rebound in the core support zone, they are expected to form a new bottom and begin an upward trend.
Silver Price Structure: Long-Term Breakouts and Year-End Closing Prices Set the Trend
Silver has maintained a strong bullish trend in the long term. In 2025, silver prices broke through the $30 and $50 levels for the first time this year, and the year-end closing price reached a new historical high, officially completing a breakthrough of key price levels.
Looking back at history, silver has generally followed a cup and handle pattern over the past 40 years. In 2011 and 2024, silver prices twice attempted to break through $30, but both times experienced significant pullbacks. The breakout in 2025 completely reversed this pattern, with silver prices surging to $120 in 2026. Based on the technical analysis of the cup and handle pattern, the target price for this long-term rally is $250 to $300, representing an overall potential increase of 700%.
The year-end closing price determines the medium- to long-term trend of silver.
To determine the subsequent trend after this round of correction, the closing price of silver at the end of 2026 is the key indicator: if the closing price for the whole year stays above $100, the bullish trend of silver will continue in 2027.
Silver prices are currently at historical highs, and profit-taking has triggered a pullback. Based on trend projections, if the closing price in 2026 holds above $100, silver prices are likely to continue their upward trend in 2027.
If silver prices continue to fall throughout the year and close below $100 at the end of the year, two possible paths will emerge: First, silver prices may fall to $50 and then stabilize and rebound, once again challenging the $250 target; second, silver prices may experience a deep correction to around $30 before resuming their upward trend and challenging $250.
If the year-end closing price falls below $30, the long-term bullish trend for silver will be completely invalidated, and the market will continue to weaken for the next few quarters. However, at present, this possibility is extremely low.
Since hitting a record high of $120 in 2026, silver prices have fallen by nearly 50%. The annual candlestick chart for silver in 2026 shows dramatic fluctuations, with a pattern highly similar to that of silver when it reached its historical highs in 1980 and 2011. The high volatility of this round of market movements can be clearly seen in the long-term linear chart.
Overall, the long-term trend will ultimately depend on the year-end closing price. If silver prices find a bottom at $50 and rebound back above $100, the outlook for 2027 will be more optimistic. In summary, $50 is currently the first key support level for silver; if it breaks below this level, the price will likely fall further to the $30-$31 range.
Short-term market trend: Focus on the $50-$60 support zone
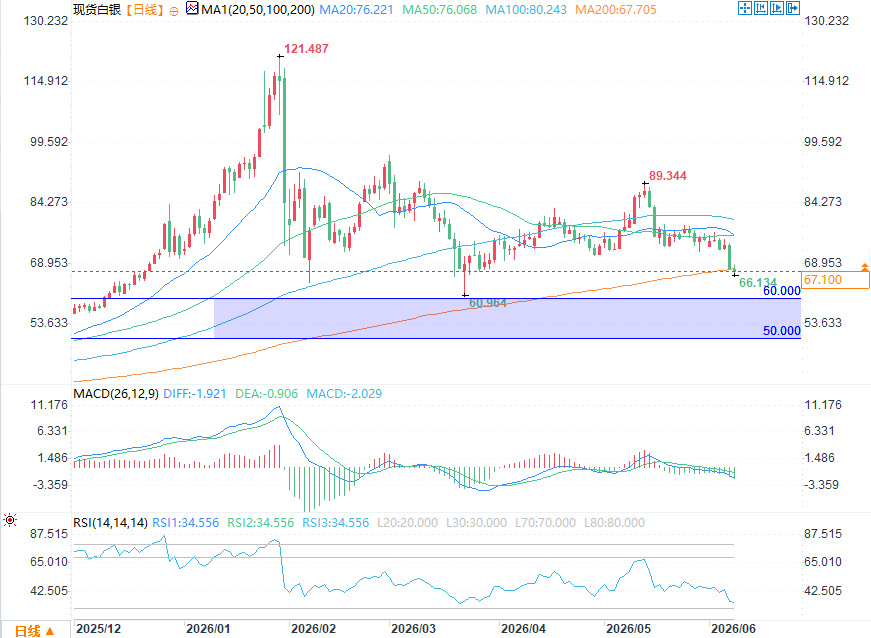
(Spot silver daily chart source: EasyTrade)
Based on previous analysis, silver is clearly in a short-term correction phase. In May 2026, silver prices formed a bearish hammer candlestick below $100, indicating a significant pullback with a target range of $50 to $60, which is the buying range. Simultaneously, a bullish flag pattern has emerged on the technical charts, suggesting that silver prices are likely to continue their downward trend towards this support area in June.
If silver prices find support in the $50-$60 range and show signs of strengthening, a short-term bottom will be formed, with a target of $100 for the rebound. Considering both fundamentals and technicals, this recent decline is more of a "buying opportunity" or "shakeout," presenting a new buying signal: after a short-term rebound to $100, silver prices are expected to break through the historical high of $120 again, moving towards the long-term target of $250-$300.
Market Risks: Fed Policy and $50 Support Level Become Key Factors
The biggest risk for silver right now is a decisive break below the key support level of $50. If this level is breached, the pullback will be much deeper, with prices heading straight for the $30-$31 range. This would completely shatter the short-term bullish momentum and postpone the start of a new bull market. If the year-end closing price falls below $30, silver's long-term breakout pattern, which has lasted for several years, will also be invalidated.
Short-term macroeconomic risks mainly come from three aspects: rising US Treasury yields, continued strengthening of the US dollar, and escalating market concerns about the Federal Reserve raising interest rates.
On the other hand, whether industrial demand for silver can offset the negative impact of monetary policy is also a major uncertainty. Although US manufacturing data is recovering, the ongoing turmoil in the Middle East continues to push up inflation. If inflation remains high, the Federal Reserve will be forced to maintain a tight monetary policy for an extended period. Even with a supply gap in silver and continued growth in demand from new energy sources, it will be difficult to withstand the suppression of monetary policy. Therefore, silver prices must hold the support range of $50 to $60 and successfully establish a bottom to avoid a new round of deep declines.
Silver Market Outlook
In summary, silver is under short-term downward pressure, but the long-term trend is positive. After breaking below $70, silver prices are currently moving towards the $50-$60 support zone.
If the price rebounds from the $50-$60 range to $100, it will form a solid bottom, then challenge the historical high of $120, and finally head towards the long-term target of $250-$300.
If the price breaks below $50, it will likely experience a significant pullback to $30-$31.
As long as the $30 mark is not breached, the long-term bullish structure of silver will remain unchanged.
Strong US employment data has fueled market expectations that the Federal Reserve will maintain high interest rates for an extended period. Coupled with rising US Treasury yields and a stronger dollar, spot silver has remained under pressure, and precious metals as a whole have been negatively impacted. In my view, this price correction will create a significant new buying opportunity for long-term investors. This article will analyze the impact of various macroeconomic factors on the future price trend of silver, considering macroeconomic fundamentals, inflationary risks driven by oil prices, and divergent signals from the US Institute for Supply Management (ISM) manufacturing data, examining both short-term and long-term price movements.
Concerns about Fed rate hikes and oil price inflation are both weighing on silver prices.
Strong US employment data reignited market fears of a Federal Reserve rate hike, putting downward pressure on silver prices in the short term. Rising interest rates and a stronger dollar have weakened market demand for precious metals, causing both gold and silver to decline. However, compared to gold, silver has stronger industrial demand as a fundamental support.
Even with industrial demand providing some support, silver's decline in this round far exceeded that of gold, resulting in significant market volatility. Last week, gold fell by a cumulative 4.68%, while silver plummeted by 10.01%; on the day the US employment data was released, gold fell by 3.29% in a single day, while silver plunged by an even steeper 8.31%. The market's expectation that positive US labor data would prompt the Federal Reserve to restart interest rate hikes is the core reason for this round of sharp declines.
Oil price trends are also a key variable affecting silver. Renewed tensions in the Middle East have driven up oil prices, leading to rising inflation expectations and putting silver in a dilemma: in the long term, inflation benefits physical assets, but high inflation will force the Federal Reserve to maintain high interest rates for an extended period. This is the core logic behind the current inflationary environment, which suggests that silver will likely continue to decline in the short term.
The US ISM Manufacturing Purchasing Managers' Index (PMI) showed mixed results. Data showed that US manufacturing activity rebounded somewhat in May, with new orders also improving. Silver is widely used in electronics, photovoltaics, power facilities, and various industrial consumables; theoretically, a manufacturing recovery should boost industrial demand for silver.
However, the ISM price sub-index shows that business cost pressures remain high due to the impact of oil derivatives, tariffs, and steel and aluminum product prices. While manufacturing demand is recovering, persistently high inflation risks have further strengthened market expectations of a tighter monetary policy from the Federal Reserve, continuing to put downward pressure on silver prices.
Review of this round of silver price correction
As previously analyzed, silver has entered a clear short-term correction cycle. It was previously predicted that after breaking below the $70 mark, silver prices would further decline to the $50-$60 range, an area expected to attract significant buying interest. Now, with silver prices falling continuously, market volatility increasing, and short-term upward momentum lacking, the importance of this support level is becoming increasingly apparent.
However, the short-term pullback has not changed the overall bullish trend for silver. This long-term bull market is supported by multiple positive factors: silver prices breaking through previous resistance levels, market supply shortages, steady growth in industrial demand, and incremental demand from new energy and artificial intelligence infrastructure construction. Silver prices may still have room to fall in the short term, but once they rebound in the core support zone, they are expected to form a new bottom and begin an upward trend.
Silver Price Structure: Long-Term Breakouts and Year-End Closing Prices Set the Trend
Silver has maintained a strong bullish trend in the long term. In 2025, silver prices broke through the $30 and $50 levels for the first time this year, and the year-end closing price reached a new historical high, officially completing a breakthrough of key price levels.
Looking back at history, silver has generally followed a cup and handle pattern over the past 40 years. In 2011 and 2024, silver prices twice attempted to break through $30, but both times experienced significant pullbacks. The breakout in 2025 completely reversed this pattern, with silver prices surging to $120 in 2026. Based on the technical analysis of the cup and handle pattern, the target price for this long-term rally is $250 to $300, representing an overall potential increase of 700%.
The year-end closing price determines the medium- to long-term trend of silver.
To determine the subsequent trend after this round of correction, the closing price of silver at the end of 2026 is the key indicator: if the closing price for the whole year stays above $100, the bullish trend of silver will continue in 2027.
Silver prices are currently at historical highs, and profit-taking has triggered a pullback. Based on trend projections, if the closing price in 2026 holds above $100, silver prices are likely to continue their upward trend in 2027.
If silver prices continue to fall throughout the year and close below $100 at the end of the year, two possible paths will emerge: First, silver prices may fall to $50 and then stabilize and rebound, once again challenging the $250 target; second, silver prices may experience a deep correction to around $30 before resuming their upward trend and challenging $250.
If the year-end closing price falls below $30, the long-term bullish trend for silver will be completely invalidated, and the market will continue to weaken for the next few quarters. However, at present, this possibility is extremely low.
Since hitting a record high of $120 in 2026, silver prices have fallen by nearly 50%. The annual candlestick chart for silver in 2026 shows dramatic fluctuations, with a pattern highly similar to that of silver when it reached its historical highs in 1980 and 2011. The high volatility of this round of market movements can be clearly seen in the long-term linear chart.
Overall, the long-term trend will ultimately depend on the year-end closing price. If silver prices find a bottom at $50 and rebound back above $100, the outlook for 2027 will be more optimistic. In summary, $50 is currently the first key support level for silver; if it breaks below this level, the price will likely fall further to the $30-$31 range.
Short-term market trend: Focus on the $50-$60 support zone
(Spot silver daily chart source: EasyTrade)
Based on previous analysis, silver is clearly in a short-term correction phase. In May 2026, silver prices formed a bearish hammer candlestick below $100, indicating a significant pullback with a target range of $50 to $60, which is the buying range. Simultaneously, a bullish flag pattern has emerged on the technical charts, suggesting that silver prices are likely to continue their downward trend towards this support area in June.
If silver prices find support in the $50-$60 range and show signs of strengthening, a short-term bottom will be formed, with a target of $100 for the rebound. Considering both fundamentals and technicals, this recent decline is more of a "buying opportunity" or "shakeout," presenting a new buying signal: after a short-term rebound to $100, silver prices are expected to break through the historical high of $120 again, moving towards the long-term target of $250-$300.
Market Risks: Fed Policy and $50 Support Level Become Key Factors
The biggest risk for silver right now is a decisive break below the key support level of $50. If this level is breached, the pullback will be much deeper, with prices heading straight for the $30-$31 range. This would completely shatter the short-term bullish momentum and postpone the start of a new bull market. If the year-end closing price falls below $30, silver's long-term breakout pattern, which has lasted for several years, will also be invalidated.
Short-term macroeconomic risks mainly come from three aspects: rising US Treasury yields, continued strengthening of the US dollar, and escalating market concerns about the Federal Reserve raising interest rates.
On the other hand, whether industrial demand for silver can offset the negative impact of monetary policy is also a major uncertainty. Although US manufacturing data is recovering, the ongoing turmoil in the Middle East continues to push up inflation. If inflation remains high, the Federal Reserve will be forced to maintain a tight monetary policy for an extended period. Even with a supply gap in silver and continued growth in demand from new energy sources, it will be difficult to withstand the suppression of monetary policy. Therefore, silver prices must hold the support range of $50 to $60 and successfully establish a bottom to avoid a new round of deep declines.
Silver Market Outlook
In summary, silver is under short-term downward pressure, but the long-term trend is positive. After breaking below $70, silver prices are currently moving towards the $50-$60 support zone.
If the price rebounds from the $50-$60 range to $100, it will form a solid bottom, then challenge the historical high of $120, and finally head towards the long-term target of $250-$300.
If the price breaks below $50, it will likely experience a significant pullback to $30-$31.
As long as the $30 mark is not breached, the long-term bullish structure of silver will remain unchanged.
- Risk Warning and Disclaimer
- The market involves risk, and trading may not be suitable for all investors. This article is for reference only and does not constitute personal investment advice, nor does it take into account certain users’ specific investment objectives, financial situation, or other needs. Any investment decisions made based on this information are at your own risk.