Gold prices fell as hopes for Middle East peace faded and a stronger dollar pressured gold prices.
2026-06-10 01:41:09
On Tuesday (June 10), spot gold fell to its lowest level since March during the US trading session. On one hand, the outlook for a ceasefire in the Middle East remained uncertain, leading to a strong rebound in the US dollar; on the other hand, expectations of a hawkish Federal Reserve policy continued to suppress the price of gold, a non-interest-bearing asset.

Spot gold was trading at around $4,260 per ounce, down from its intraday high of $4,350, a 1.60% drop for the day. US President Trump tweeted that Iran shot down a US Apache helicopter patrolling over the Strait of Hormuz. He stated that both pilots were safe and sound, but emphasized that the US would respond to the attack.
Earlier on Tuesday, Trump also stated that US-Iran negotiations had entered the "final sprint" and that an agreement could be reached within days. He told reporters, "We're about to finalize a very, very good deal," adding that once the agreement is signed, navigation in the Strait of Hormuz will immediately resume.
These contradictory statements significantly weakened market expectations for a short-term peace agreement, causing the dollar to rebound strongly from its intraday low. The dollar index (DXY), which measures the dollar against six major currencies, was at around 100.00, rebounding from a low of 99.68.
Gold's next key test: US inflation data
The market is closely watching the U.S. CPI (Consumer Price Index) data on Wednesday (June 11).
Inflation continues to deviate from the Federal Reserve's 2% target: Following the outbreak of the Middle East war at the end of February, rising oil prices further fueled inflationary pressures. The US CPI rose 3.3% year-on-year in March and reached 3.8% in April; economists predict it will rise to 4.2% in May.
If CPI data rises higher than expected, it will strengthen market bets on a Fed rate hike this year, further weighing on gold (gold performs better in a low-interest-rate environment). Conversely, if inflation is lower than expected, the Fed may maintain a wait-and-see attitude, and gold prices may rebound in the short term.
However, the upside potential for gold prices may be limited: the market still generally believes that US interest rates will remain high for a long time—unless the US-Iran agreement drives oil prices down and significantly alleviates inflation concerns.
Technical Analysis: Gold prices are currently stable, but the trend is weak.
On the daily chart, spot gold prices continue to be pressured below the middle Bollinger Band (approximately $4,495) and have broken below the lower Bollinger Band (approximately $4,291), clearly indicating a short-term bearish trend.
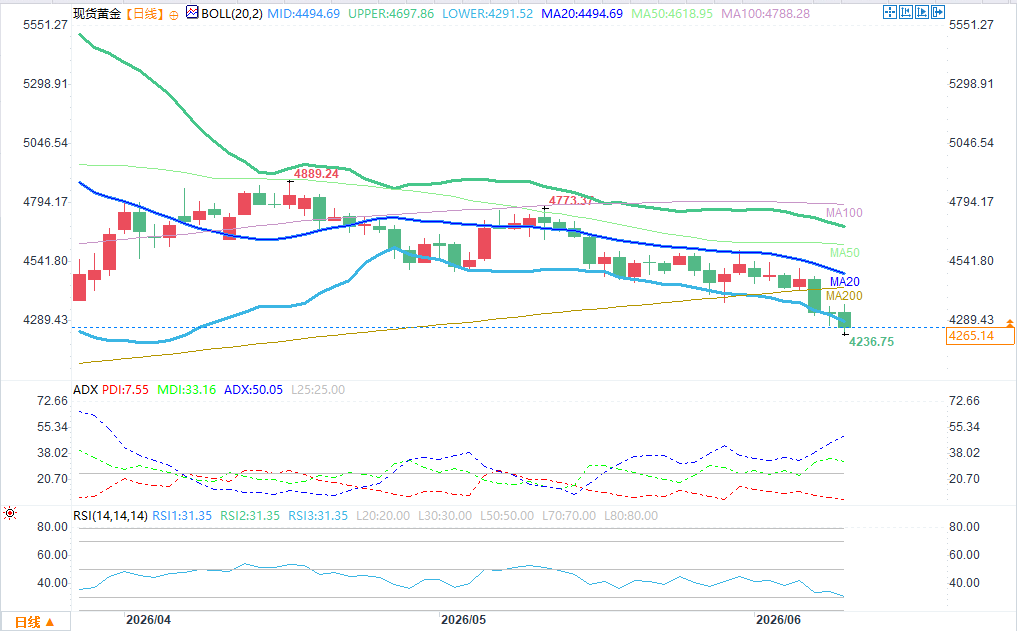
(Spot gold daily chart source: FX678)
RSI (Relative Strength Index): The current reading is around 31, near 30, indicating that downward pressure continues but has not yet entered the extreme oversold zone.
ADX (Average Directional Index): The reading reached 50.05, confirming that the downtrend is strengthening rather than being range-bound, and that bearish forces are in control.
Resistance level:
First resistance: lower Bollinger Band (approximately $4,291);
Key resistance: Bollinger Band middle line/MA20 moving average (approximately $4495);
Strong resistance: Bollinger Band upper rail (approximately $4690).
Support level:
First support: around the previous low of $4236;
Key support: The $4,100 support level. A break below this level would open up further downside potential, and the overall downtrend would continue.
Spot gold was trading at around $4,260 per ounce, down from its intraday high of $4,350, a 1.60% drop for the day. US President Trump tweeted that Iran shot down a US Apache helicopter patrolling over the Strait of Hormuz. He stated that both pilots were safe and sound, but emphasized that the US would respond to the attack.
Earlier on Tuesday, Trump also stated that US-Iran negotiations had entered the "final sprint" and that an agreement could be reached within days. He told reporters, "We're about to finalize a very, very good deal," adding that once the agreement is signed, navigation in the Strait of Hormuz will immediately resume.
These contradictory statements significantly weakened market expectations for a short-term peace agreement, causing the dollar to rebound strongly from its intraday low. The dollar index (DXY), which measures the dollar against six major currencies, was at around 100.00, rebounding from a low of 99.68.
Gold's next key test: US inflation data
The market is closely watching the U.S. CPI (Consumer Price Index) data on Wednesday (June 11).
Inflation continues to deviate from the Federal Reserve's 2% target: Following the outbreak of the Middle East war at the end of February, rising oil prices further fueled inflationary pressures. The US CPI rose 3.3% year-on-year in March and reached 3.8% in April; economists predict it will rise to 4.2% in May.
If CPI data rises higher than expected, it will strengthen market bets on a Fed rate hike this year, further weighing on gold (gold performs better in a low-interest-rate environment). Conversely, if inflation is lower than expected, the Fed may maintain a wait-and-see attitude, and gold prices may rebound in the short term.
However, the upside potential for gold prices may be limited: the market still generally believes that US interest rates will remain high for a long time—unless the US-Iran agreement drives oil prices down and significantly alleviates inflation concerns.
Technical Analysis: Gold prices are currently stable, but the trend is weak.
On the daily chart, spot gold prices continue to be pressured below the middle Bollinger Band (approximately $4,495) and have broken below the lower Bollinger Band (approximately $4,291), clearly indicating a short-term bearish trend.
(Spot gold daily chart source: FX678)
RSI (Relative Strength Index): The current reading is around 31, near 30, indicating that downward pressure continues but has not yet entered the extreme oversold zone.
ADX (Average Directional Index): The reading reached 50.05, confirming that the downtrend is strengthening rather than being range-bound, and that bearish forces are in control.
Resistance level:
First resistance: lower Bollinger Band (approximately $4,291);
Key resistance: Bollinger Band middle line/MA20 moving average (approximately $4495);
Strong resistance: Bollinger Band upper rail (approximately $4690).
Support level:
First support: around the previous low of $4236;
Key support: The $4,100 support level. A break below this level would open up further downside potential, and the overall downtrend would continue.
- Risk Warning and Disclaimer
- The market involves risk, and trading may not be suitable for all investors. This article is for reference only and does not constitute personal investment advice, nor does it take into account certain users’ specific investment objectives, financial situation, or other needs. Any investment decisions made based on this information are at your own risk.