Gold Analysis: Gold Price Rebound Encounters Resistance, Intensifying Battle Between Bulls and Bears
2026-06-13 01:52:57
This week, the core market catalyst revolved around the US-Iran geopolitical situation, becoming the key variable influencing short-term gold price fluctuations. US President Trump publicly stated on Thursday that he had canceled plans for military strikes against Iran and released a significant signal, stating that a US-Iran peace agreement was expected to be formally signed by the end of the week. This positive news significantly improved market risk sentiment, directly driving a strong rebound in gold from a near seven-month low of $4023, while simultaneously suppressing safe-haven buying, causing the US dollar index and international oil prices to weaken in tandem. Subsequently, Iranian Foreign Minister Abbas Araqchi also confirmed the progress of the negotiations, admitting that a US-Iran memorandum of understanding "has never been closer to being reached," and urging the media not to over-speculate on the details of the agreement, further stabilizing market expectations.

However, due to the Iranian government's continued failure to release a final confirmation of the resolution, the geopolitical benefits remain highly uncertain, leading to a rapid increase in market caution. Gold prices were unable to sustain Thursday's rebound and entered a sideways consolidation phase. Spot gold was quoted at approximately $4200 per ounce, having reached a high of $4246 during the day. Overall volatility narrowed, and the battle between bulls and bears tended to be balanced.
Besides geopolitical tensions, US inflation data and expectations for the Federal Reserve's monetary policy are the core negative factors that continue to suppress gold prices. This week's key US inflation data significantly exceeded expectations, thoroughly reinforcing the market consensus that the Federal Reserve will maintain high interest rates in the long term, thus putting continuous pressure on gold, a non-interest-bearing asset.
Data shows that the US Consumer Price Index (CPI) rose 4.2% year-on-year in May, a significant rebound from April's 3.8% increase, reaching a new high since April 2023. Meanwhile, the Producer Price Index (PPI) rose 6.5% year-on-year in May, higher than the previous value of 5.7%, reaching its peak since November 2022. This high-inflation environment means that the Federal Reserve's interest rate cut cycle will be further delayed, and there is even a potential for subsequent rate hikes. The persistently high market borrowing costs continue to weaken the attractiveness of gold as an investment.
The latest consumer sentiment data released by the University of Michigan has further complicated market conditions. The Michigan Consumer Sentiment Index rose to 48.9 in June from 44.8 in May, significantly exceeding the market expectation of 46, reflecting a recovery in US consumer sentiment. Meanwhile, market inflation expectations declined slightly, with one-year inflation expectations falling to 4.6% and five-year inflation expectations falling to 3.4%, both lower than previous levels.
The divergent data has made the market more cautious in its assessment of the Federal Reserve's monetary policy. Coupled with the uncertainty surrounding the timing and terms of the US-Iran agreement, this has effectively limited the downside potential of the US dollar index. As of the current market data, the US dollar index (DXY) is fluctuating narrowly around 99.78. The slightly resilient dollar continues to put pressure on gold, essentially locking in a two-week losing streak for precious metals.
Technical Analysis: The downtrend remains unchanged; the short-term rebound is merely a weak correction.
From a technical perspective, spot gold is weak in both the short and medium term, with the main downtrend yet to reverse and bullish momentum severely lacking. Currently, gold prices are consistently trading below the 20-day moving average (MA20), which is around $4425.45, forming strong short-term resistance. All recent rebounds are merely temporary technical corrections within the downtrend and do not constitute a reversal.
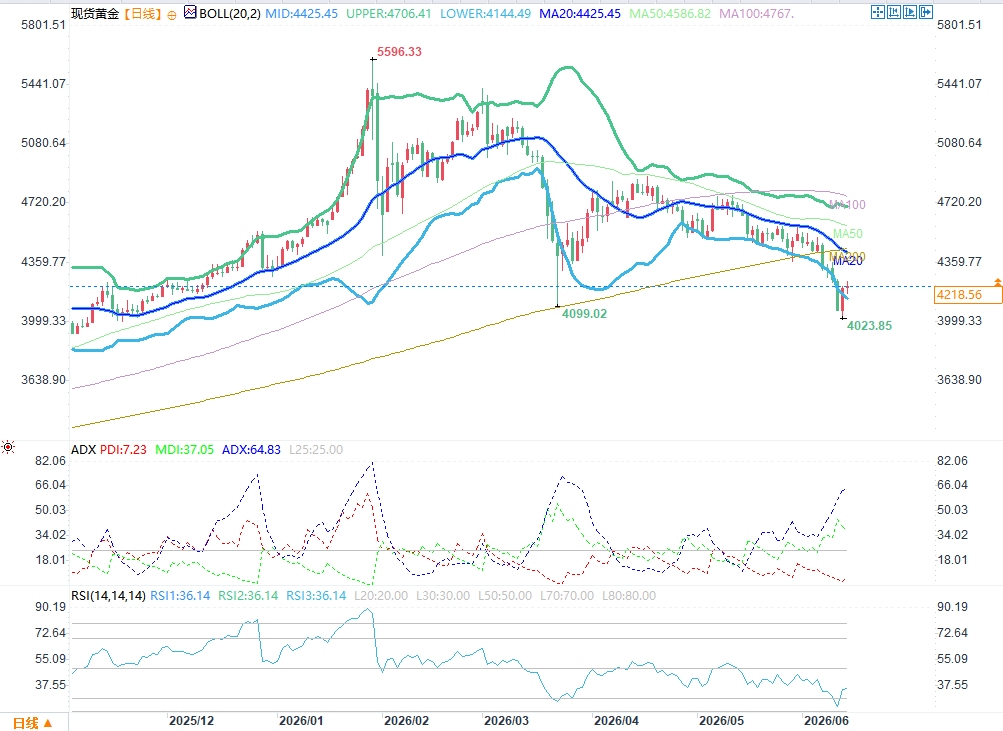
(Spot gold daily chart source: FX678)
From a technical perspective, the market's upward momentum remains weak.
The Relative Strength Index (RSI) (14) is 36.14, which is in the weak range, directly reflecting the lack of upward momentum and weak bullish strength in gold prices. There is no obvious oversold stabilization signal yet. The Average Directional Index (ADX) is currently reading 64.83, which has entered the high range, indicating that the current downward trend in the market is still continuing.
Regarding Bollinger Bands (BOLL), the current price is trading near the lower Bollinger Band ($4144.49), and short-term rebounds are limited by the resistance of the middle Bollinger Band ($4425.45). The narrowing range has not changed the overall downward channel structure.
Regarding support and resistance levels:
Support levels: Short-term key support is located near the lower Bollinger Band at $4144.49, while the previous low of $4023.85 forms strong support. The core strong support in the medium term remains at the $4000 psychological level. This price level has both strong psychological and historical technical support attributes and is also the last key line of defense for the bulls. Institutional and retail investors are likely to concentrate their buying at this level to prevent gold prices from falling further.
Resistance levels: The first short-term resistance is at $4425.45, where the Bollinger Band middle line coincides with the 20-day moving average. The second strong resistance is located at the upper Bollinger Band area of $4706.41. Only by effectively breaking through these two resistance zones and simultaneously holding above the MA50 ($4586.82) can gold prices break the current weak pattern and reverse the medium-term downtrend.
Institutional View: With multiple negative factors converging, gold has not yet begun a clear rebound cycle.
A recent research report from TD Securities' strategy team points out that the current expectation of high interest rates from the Federal Reserve is firmly limiting the upside potential of gold, making it difficult for precious metals as a whole to accumulate sustained upward momentum. High inflation driving up real interest rates continues to suppress the valuation of non-interest-bearing precious metals, becoming the core constraint on a gold rebound. At the same time, the market trading structure is weak, with commodity trading advisors (CTAs) maintaining a slight short position overall. Institutional short-selling activities continue to disrupt the market, significantly compressing the gold price fluctuation range and making it difficult to establish a trend.
TD Securities further analyzed that the current market fundamentals are mixed, with both advantages and disadvantages. Although the expectation of easing tensions between the US and Iran and high energy prices have provided some bottom support for gold, preventing a one-sided collapse and effectively preventing the price from falling below the key $4,000 level and triggering a new round of large-scale selling, the fragile peace agreement framework, lingering inflationary pressures, and the Federal Reserve's hawkish monetary policy stance all determine that gold has not yet escaped its weak predicament and is unlikely to start a definite rebound in the short term. Overall, it will maintain a weak and volatile pattern.
However, due to the Iranian government's continued failure to release a final confirmation of the resolution, the geopolitical benefits remain highly uncertain, leading to a rapid increase in market caution. Gold prices were unable to sustain Thursday's rebound and entered a sideways consolidation phase. Spot gold was quoted at approximately $4200 per ounce, having reached a high of $4246 during the day. Overall volatility narrowed, and the battle between bulls and bears tended to be balanced.
Besides geopolitical tensions, US inflation data and expectations for the Federal Reserve's monetary policy are the core negative factors that continue to suppress gold prices. This week's key US inflation data significantly exceeded expectations, thoroughly reinforcing the market consensus that the Federal Reserve will maintain high interest rates in the long term, thus putting continuous pressure on gold, a non-interest-bearing asset.
Data shows that the US Consumer Price Index (CPI) rose 4.2% year-on-year in May, a significant rebound from April's 3.8% increase, reaching a new high since April 2023. Meanwhile, the Producer Price Index (PPI) rose 6.5% year-on-year in May, higher than the previous value of 5.7%, reaching its peak since November 2022. This high-inflation environment means that the Federal Reserve's interest rate cut cycle will be further delayed, and there is even a potential for subsequent rate hikes. The persistently high market borrowing costs continue to weaken the attractiveness of gold as an investment.
The latest consumer sentiment data released by the University of Michigan has further complicated market conditions. The Michigan Consumer Sentiment Index rose to 48.9 in June from 44.8 in May, significantly exceeding the market expectation of 46, reflecting a recovery in US consumer sentiment. Meanwhile, market inflation expectations declined slightly, with one-year inflation expectations falling to 4.6% and five-year inflation expectations falling to 3.4%, both lower than previous levels.
The divergent data has made the market more cautious in its assessment of the Federal Reserve's monetary policy. Coupled with the uncertainty surrounding the timing and terms of the US-Iran agreement, this has effectively limited the downside potential of the US dollar index. As of the current market data, the US dollar index (DXY) is fluctuating narrowly around 99.78. The slightly resilient dollar continues to put pressure on gold, essentially locking in a two-week losing streak for precious metals.
Technical Analysis: The downtrend remains unchanged; the short-term rebound is merely a weak correction.
From a technical perspective, spot gold is weak in both the short and medium term, with the main downtrend yet to reverse and bullish momentum severely lacking. Currently, gold prices are consistently trading below the 20-day moving average (MA20), which is around $4425.45, forming strong short-term resistance. All recent rebounds are merely temporary technical corrections within the downtrend and do not constitute a reversal.
(Spot gold daily chart source: FX678)
From a technical perspective, the market's upward momentum remains weak.
The Relative Strength Index (RSI) (14) is 36.14, which is in the weak range, directly reflecting the lack of upward momentum and weak bullish strength in gold prices. There is no obvious oversold stabilization signal yet. The Average Directional Index (ADX) is currently reading 64.83, which has entered the high range, indicating that the current downward trend in the market is still continuing.
Regarding Bollinger Bands (BOLL), the current price is trading near the lower Bollinger Band ($4144.49), and short-term rebounds are limited by the resistance of the middle Bollinger Band ($4425.45). The narrowing range has not changed the overall downward channel structure.
Regarding support and resistance levels:
Support levels: Short-term key support is located near the lower Bollinger Band at $4144.49, while the previous low of $4023.85 forms strong support. The core strong support in the medium term remains at the $4000 psychological level. This price level has both strong psychological and historical technical support attributes and is also the last key line of defense for the bulls. Institutional and retail investors are likely to concentrate their buying at this level to prevent gold prices from falling further.
Resistance levels: The first short-term resistance is at $4425.45, where the Bollinger Band middle line coincides with the 20-day moving average. The second strong resistance is located at the upper Bollinger Band area of $4706.41. Only by effectively breaking through these two resistance zones and simultaneously holding above the MA50 ($4586.82) can gold prices break the current weak pattern and reverse the medium-term downtrend.
Institutional View: With multiple negative factors converging, gold has not yet begun a clear rebound cycle.
A recent research report from TD Securities' strategy team points out that the current expectation of high interest rates from the Federal Reserve is firmly limiting the upside potential of gold, making it difficult for precious metals as a whole to accumulate sustained upward momentum. High inflation driving up real interest rates continues to suppress the valuation of non-interest-bearing precious metals, becoming the core constraint on a gold rebound. At the same time, the market trading structure is weak, with commodity trading advisors (CTAs) maintaining a slight short position overall. Institutional short-selling activities continue to disrupt the market, significantly compressing the gold price fluctuation range and making it difficult to establish a trend.
TD Securities further analyzed that the current market fundamentals are mixed, with both advantages and disadvantages. Although the expectation of easing tensions between the US and Iran and high energy prices have provided some bottom support for gold, preventing a one-sided collapse and effectively preventing the price from falling below the key $4,000 level and triggering a new round of large-scale selling, the fragile peace agreement framework, lingering inflationary pressures, and the Federal Reserve's hawkish monetary policy stance all determine that gold has not yet escaped its weak predicament and is unlikely to start a definite rebound in the short term. Overall, it will maintain a weak and volatile pattern.
- Risk Warning and Disclaimer
- The market involves risk, and trading may not be suitable for all investors. This article is for reference only and does not constitute personal investment advice, nor does it take into account certain users’ specific investment objectives, financial situation, or other needs. Any investment decisions made based on this information are at your own risk.