USD/CAD Analysis: Canadian Dollar Rebounds Following CPI Data and Bank of Canada Decision
2026-06-11 02:16:21
In the past two trading days, the Canadian dollar has regained its upward momentum, becoming one of the key short-term factors influencing the market. As a result, the USD/CAD exchange rate has continued to weaken, falling by approximately 0.18% cumulatively over the two trading days.
Following the release of the US Consumer Price Index (CPI) data, the USD/CAD pair continued its slight downward trend. Currently, the market is not experiencing a sustained, strong bearish trend; the Canadian dollar has only recovered some lost ground, and the USD/CAD pair has entered a period of consolidation and oscillation, a pattern likely to continue in subsequent trading days.
Key Takeaways: US CPI Data Becomes Market Focus
During this trading session, the US released its latest CPI inflation data, showing a year-on-year increase of 4.2%, fully in line with market expectations. Although this figure is slightly higher than the previous value of 3.8%, it did not exceed previous market forecasts, thus alleviating market concerns about inflation in the short term.
However, inflation remains a key risk that the market needs to be wary of. But in the short term, however, this inflation data has not strengthened market expectations for aggressive interest rate hikes by the Federal Reserve in the coming months.
Judging from the pricing probability of the Federal Reserve's monetary policy, market expectations for a December rate hike have not changed significantly. Current market pricing indicates a 42.67% probability of a 25 basis point rate hike at the Fed's December 9th meeting, compared to 43.33% on the previous trading day. This demonstrates that the CPI data has not had a substantial impact on market expectations for monetary policy.
Following the data release, the yield on the 10-year US Treasury bond remained stable, fluctuating slightly above 4.5% in the short term. Although the US Treasury yield is still higher than the yield on the 10-year Canadian government bond (approximately 3.5%), the US Treasury yield failed to stage a strong upward trend, thus failing to provide sustained buying support for the US dollar.
Overall, the US CPI data met market expectations, alleviating concerns about aggressive monetary tightening by the Federal Reserve, leading to a neutral stance for the US dollar and a modest rebound in the Canadian dollar. Until the Federal Reserve releases a clear signal regarding its future policy path, the USD/CAD pair is likely to continue its range-bound trading pattern.
Interpretation of the Bank of Canada's Interest Rate Decision
During this period, the Bank of Canada announced its latest interest rate decision, maintaining the benchmark interest rate unchanged at 2.25%. The central bank stated that there is currently insufficient evidence to suggest that rising energy prices have been widely transmitted to the goods and services sector. Meanwhile, Canadian inflation has not yet posed a substantial risk; the year-on-year inflation average in April was 2.8%, slightly below the central bank's upper limit of the 3.0% inflation target.
This Bank of Canada decision did not provide sustained and strong upward momentum for the Canadian dollar. The Bank of Canada's short-term policy stance remains cautious, and the market cannot predict when it will resume raising interest rates. The wording of the decision also did not signal any aggressive tightening.
Therefore, the current slight strengthening of the Canadian dollar is not primarily driven by the positive impact of the Bank of Canada's decision, but rather by the short-term weakening of the US dollar.
Currently, the Bank of Canada's wait-and-see policy stance remains the core theme of the market. If subsequent Canadian inflation data rises, or the central bank releases hawkish comments, the market will repric its expectations for interest rate hikes. At that time, the attractiveness of Canadian dollar assets will increase in the short term, potentially driving the USD/CAD pair out of its medium-term downtrend.
Technical Analysis
The USD/CAD exchange rate has been trending upwards in recent weeks, with the short-term trading range becoming increasingly clear: key resistance is at 1.3939, while core support lies at the previous low of 1.3549. The exchange rate is currently fluctuating within this range, and no clear breakout signal has yet emerged. As long as the upper resistance level continues to exert downward pressure, the market is likely to continue its pattern of high-level consolidation or a corrective pullback.
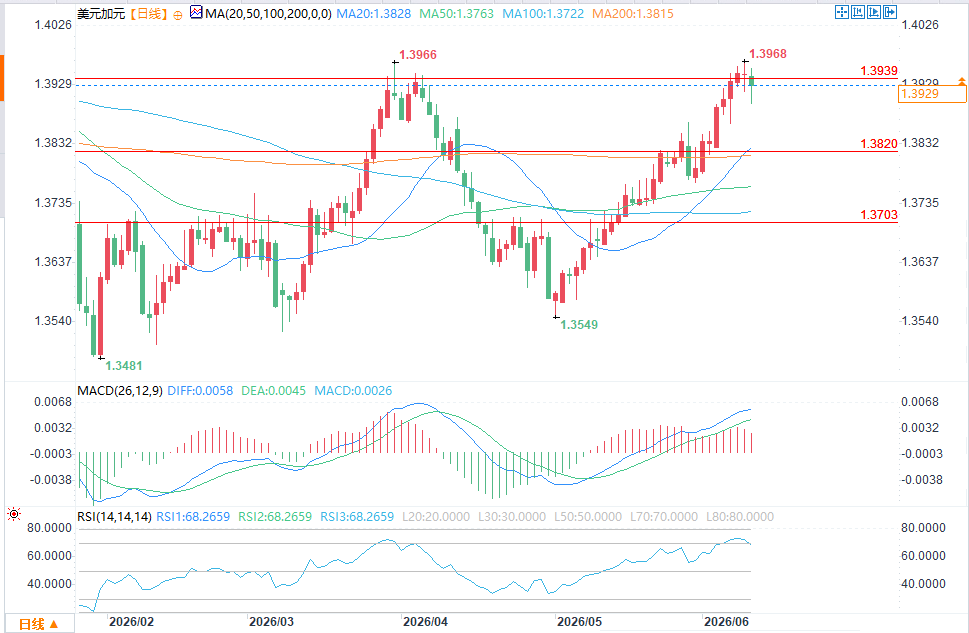
(USD/CAD daily chart source: EasyForex)
Interpretation of indicator signals
The current RSI (14) value is 68.27, which has been firmly above the 50 center, indicating that the overall bullish momentum is dominant in the short term. However, it has approached the overbought critical range of 70, reflecting that the market buying power in the previous period has been overdrawn. There is a certain risk of top divergence between price and indicator, and there is room for subsequent correction and release of overbought pressure.
The current MACD parameters (26,12,9) show: DIFF value 0.0058, DEA value 0.0045, and MACD histogram value 0.0026. The histogram has recently been flattening and showing signs of shortening, indicating a continued weakening of bullish momentum and a gradual fading of previous upward momentum. The current pattern of weak short-term buying pressure may continue. If the DIFF line crosses below the DEA line to form a death cross, it will further confirm a pullback signal.
Key price level analysis
1.3939 (key resistance level)
This level represents a recent high (currently around 1.3929, a level tested multiple times before encountering resistance and falling back), and also coincides with the extension of the horizontal resistance line from the April 2026 high of 1.3966, fitting the upper edge of the medium-to-long-term trading range. If the exchange rate effectively breaks through this level (closing price holding above it, rather than the price piercing through with a shadow), it will break the current consolidation pattern and initiate a new round of structural bullish trend, with an upside target of the psychological level of 1.40.
1.3820 (short-term support/resistance level)
This neutral price level largely coincides with the 200-period moving average (MA200: 1.3815), and is also a key support level during the recent upward trend. As the exchange rate fluctuates around this level, the battle between bulls and bears will continue. As long as this support level is not effectively broken, the overall upward trend remains intact, and the upward-trending structure can be maintained.
1.3703 (core support level)
This level represents a key support level for the recent pullback, and also serves as the converted support at the upper edge of the previous trading range. It also overlaps with the core bearish defense line below the moving average system (MA100: 1.3722, MA50: 1.3763 are both above this level). If the exchange rate falls below this level and breaks down decisively, bearish forces will gradually gain dominance, significantly increasing the downside risk. The next support target will be the recent low of 1.3549.
Following the release of the US Consumer Price Index (CPI) data, the USD/CAD pair continued its slight downward trend. Currently, the market is not experiencing a sustained, strong bearish trend; the Canadian dollar has only recovered some lost ground, and the USD/CAD pair has entered a period of consolidation and oscillation, a pattern likely to continue in subsequent trading days.
Key Takeaways: US CPI Data Becomes Market Focus
During this trading session, the US released its latest CPI inflation data, showing a year-on-year increase of 4.2%, fully in line with market expectations. Although this figure is slightly higher than the previous value of 3.8%, it did not exceed previous market forecasts, thus alleviating market concerns about inflation in the short term.
However, inflation remains a key risk that the market needs to be wary of. But in the short term, however, this inflation data has not strengthened market expectations for aggressive interest rate hikes by the Federal Reserve in the coming months.
Judging from the pricing probability of the Federal Reserve's monetary policy, market expectations for a December rate hike have not changed significantly. Current market pricing indicates a 42.67% probability of a 25 basis point rate hike at the Fed's December 9th meeting, compared to 43.33% on the previous trading day. This demonstrates that the CPI data has not had a substantial impact on market expectations for monetary policy.
Following the data release, the yield on the 10-year US Treasury bond remained stable, fluctuating slightly above 4.5% in the short term. Although the US Treasury yield is still higher than the yield on the 10-year Canadian government bond (approximately 3.5%), the US Treasury yield failed to stage a strong upward trend, thus failing to provide sustained buying support for the US dollar.
Overall, the US CPI data met market expectations, alleviating concerns about aggressive monetary tightening by the Federal Reserve, leading to a neutral stance for the US dollar and a modest rebound in the Canadian dollar. Until the Federal Reserve releases a clear signal regarding its future policy path, the USD/CAD pair is likely to continue its range-bound trading pattern.
Interpretation of the Bank of Canada's Interest Rate Decision
During this period, the Bank of Canada announced its latest interest rate decision, maintaining the benchmark interest rate unchanged at 2.25%. The central bank stated that there is currently insufficient evidence to suggest that rising energy prices have been widely transmitted to the goods and services sector. Meanwhile, Canadian inflation has not yet posed a substantial risk; the year-on-year inflation average in April was 2.8%, slightly below the central bank's upper limit of the 3.0% inflation target.
This Bank of Canada decision did not provide sustained and strong upward momentum for the Canadian dollar. The Bank of Canada's short-term policy stance remains cautious, and the market cannot predict when it will resume raising interest rates. The wording of the decision also did not signal any aggressive tightening.
Therefore, the current slight strengthening of the Canadian dollar is not primarily driven by the positive impact of the Bank of Canada's decision, but rather by the short-term weakening of the US dollar.
Currently, the Bank of Canada's wait-and-see policy stance remains the core theme of the market. If subsequent Canadian inflation data rises, or the central bank releases hawkish comments, the market will repric its expectations for interest rate hikes. At that time, the attractiveness of Canadian dollar assets will increase in the short term, potentially driving the USD/CAD pair out of its medium-term downtrend.
Technical Analysis
The USD/CAD exchange rate has been trending upwards in recent weeks, with the short-term trading range becoming increasingly clear: key resistance is at 1.3939, while core support lies at the previous low of 1.3549. The exchange rate is currently fluctuating within this range, and no clear breakout signal has yet emerged. As long as the upper resistance level continues to exert downward pressure, the market is likely to continue its pattern of high-level consolidation or a corrective pullback.
(USD/CAD daily chart source: EasyForex)
Interpretation of indicator signals
The current RSI (14) value is 68.27, which has been firmly above the 50 center, indicating that the overall bullish momentum is dominant in the short term. However, it has approached the overbought critical range of 70, reflecting that the market buying power in the previous period has been overdrawn. There is a certain risk of top divergence between price and indicator, and there is room for subsequent correction and release of overbought pressure.
The current MACD parameters (26,12,9) show: DIFF value 0.0058, DEA value 0.0045, and MACD histogram value 0.0026. The histogram has recently been flattening and showing signs of shortening, indicating a continued weakening of bullish momentum and a gradual fading of previous upward momentum. The current pattern of weak short-term buying pressure may continue. If the DIFF line crosses below the DEA line to form a death cross, it will further confirm a pullback signal.
Key price level analysis
1.3939 (key resistance level)
This level represents a recent high (currently around 1.3929, a level tested multiple times before encountering resistance and falling back), and also coincides with the extension of the horizontal resistance line from the April 2026 high of 1.3966, fitting the upper edge of the medium-to-long-term trading range. If the exchange rate effectively breaks through this level (closing price holding above it, rather than the price piercing through with a shadow), it will break the current consolidation pattern and initiate a new round of structural bullish trend, with an upside target of the psychological level of 1.40.
1.3820 (short-term support/resistance level)
This neutral price level largely coincides with the 200-period moving average (MA200: 1.3815), and is also a key support level during the recent upward trend. As the exchange rate fluctuates around this level, the battle between bulls and bears will continue. As long as this support level is not effectively broken, the overall upward trend remains intact, and the upward-trending structure can be maintained.
1.3703 (core support level)
This level represents a key support level for the recent pullback, and also serves as the converted support at the upper edge of the previous trading range. It also overlaps with the core bearish defense line below the moving average system (MA100: 1.3722, MA50: 1.3763 are both above this level). If the exchange rate falls below this level and breaks down decisively, bearish forces will gradually gain dominance, significantly increasing the downside risk. The next support target will be the recent low of 1.3549.
- Risk Warning and Disclaimer
- The market involves risk, and trading may not be suitable for all investors. This article is for reference only and does not constitute personal investment advice, nor does it take into account certain users’ specific investment objectives, financial situation, or other needs. Any investment decisions made based on this information are at your own risk.