Gold ETFs continue to see outflows, while demand for physical safe-haven assets surges against the trend.
2026-06-11 01:17:12
On Wednesday (June 10), spot gold prices fell sharply by 3.24% to $4,121.49 per ounce, marking the fourth consecutive day of selling. However, beneath the surface, safe-haven flows showed a significant divergence: data from New York Mercantile Exchange futures and gold ETFs showed large-scale institutional liquidation and exits, while the premium for physical gold in Asia and the activity in the over-the-counter black market confirmed that demand for hedging against geopolitical risks remained strong.

Momentum traders triggered collective stop-loss orders, exacerbating capital outflows from gold ETFs.
The main downward pressure on gold prices currently stems from the large-scale reduction in holdings of gold ETFs. Over the past two weeks, the outflow of funds from mainstream listed gold products in Europe and the US has accelerated, with daily redemptions exceeding 15 tons on several trading days. The core reason for this institutional portfolio rebalancing is margin calls and portfolio rebalancing, rather than a reversal in the market's fundamental perception of gold's safe-haven status.
The correlation between gold and real yields has broken down, further confirming that this round of decline is driven by passive liquidation rather than macroeconomic logic: the yield on 10-year US Treasury Inflation-Protected Securities (TIPS) has fallen by 22 basis points this week, but gold prices have still weakened significantly, which fully demonstrates that passive selling has dominated the market trend.
The $4,200/oz level was a solid support during the consolidation phase in May, but after gold prices broke below $4,150, this level has now become a resistance level. The next key technical support for gold is at $4,080/oz, the convergence point of the 200-day moving average. If gold prices close below $4,100, it will likely trigger stop-loss selling pressure from algorithmic trend traders—these funds have been continuously reducing their long positions after gold prices failed to hold above $4,300 this month.
Physical demand in Asia remained strong, with a clear divergence between hot and cold markets.
While funds are fleeing the paper gold market, the physical gold markets in major global consumption regions are showing a starkly different trend. The premium of gold on the Shanghai Gold Exchange over the London fixing price has widened to $18-22 per ounce, the highest level since the banking crisis in March 2025. This means that even with falling gold prices, China's demand for gold imports remains strong, primarily driven by the diversification of the People's Bank of China's foreign exchange reserves and residents' safe-haven demand for gold during the domestic real estate adjustment cycle.
The Indian market also demonstrated strong resilience, with the spot gold premium narrowing from a discount of $5 per ounce last month to near parity. Consumer demand during India's wedding season, coupled with central bank gold purchases, has effectively absorbed circulating inventory. Over the past three weeks, the Reserve Bank of India has added 8 tons of gold reserves, a typical move under the trend of de-dollarization among emerging market central banks.
The divergence between the paper gold and physical gold markets has created potential bottom support for gold prices. ETF outflows typically subside gradually after a peak, lasting four to six weeks, at which point strong physical buying will once again dominate market trends. However, short-term risks remain: passive selling in the futures market could suppress the physical gold premium, forcing prices in both markets to converge, thereby weakening the current physical support logic.
A stronger dollar coupled with the unwinding of yen carry trades put further downward pressure on gold prices.
The USD/JPY exchange rate climbed to 160.38, further complicating the future trend of gold. Historically, yen depreciation has often been accompanied by a decline in gold prices—Japanese retail investors are the core holders of Asian gold ETFs, and when the yen depreciates, investors typically sell gold to hedge against the risk of their domestic currency depreciation. The recent slight increase of 0.13% in the USD/JPY exchange rate, coinciding with gold prices hitting an intraday low, further confirms the inverse correlation between the two.
More concerning is the risk of unwinding yen carry trades. The USD/JPY exchange rate is currently approaching the 161 level, a point that triggered intervention by the Bank of Japan in the foreign exchange market in April. If the yen experiences a sudden and significant rebound, gold prices may reverse course in tandem. A 3% to 5% appreciation in the yen would likely force gold speculative long positions to be liquidated, further amplifying downward pressure on gold prices.
Currently, the annualized rate of perpetual swap funding in the over-the-counter market is -0.03%, indicating that leveraged funds have generally shifted to short positions. Historical data shows that after such an extreme positioning structure, there is often a price rebound triggered by short covering.
Silver's relatively resilient price movement is sending an important tactical signal.
In this round of precious metal correction, silver showed remarkable resilience: it fell 0.89% intraday to $64.71 per ounce, far outperforming gold's 3.24% drop. The gold-silver ratio surged to 63.7, approaching the upper limit of its six-month range. Such a sharp rise in the ratio typically occurs during periods of concentrated institutional selling—gold, with its higher institutional holdings, often bears the main selling pressure during downturns. Once the ratio stabilizes, silver usually outperforms gold in subsequent rebounds.
Furthermore, silver enjoys industrial demand support that gold lacks, with rigid industrial demand from sectors such as photovoltaic manufacturing and 5G infrastructure continuously supporting silver prices. Meanwhile, West Texas Intermediate (WTI) crude oil prices rose 2.80% to $90.67 per barrel, and higher energy prices will drive increased investment in the new energy industry, further benefiting industrial demand for silver. This cross-asset correlation suggests that gold's recent decline has already shown signs of being oversold compared to other similar monetary metals.
The $4,000 mark becomes a key defense line
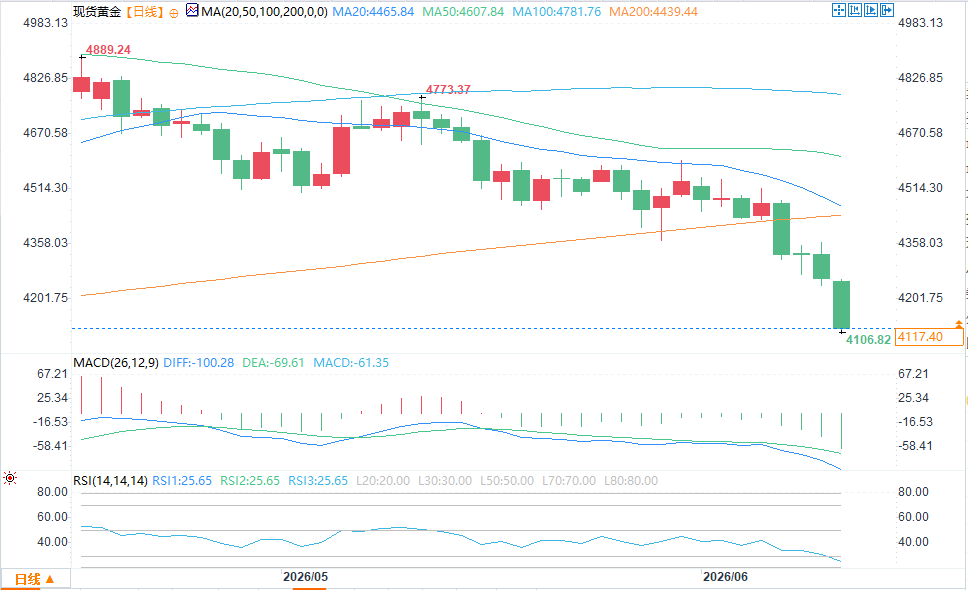
(Spot gold daily chart source: FX678)
Off-exchange data shows that in the past 72 hours, selling pressure on gold has been concentrated at the two key levels of $4,150 and $4,100. Passive buying has been accumulating in the $4,080 to $4,100 range, and algorithmic market makers are prepared to absorb market selling pressure in this range.
If gold prices decisively break below $4,080, the next target will be $3,950, which is the low point in February 2026 and the starting point for the previous rally to $4,350. However, realizing this pessimistic scenario requires the dual support of a sustained strong dollar and continued outflows from ETFs. In the short term, the more probable scenario is for gold prices to consolidate within the $4,080 to $4,200 range, with physical buying providing a floor and ETF selling pressure limiting any potential rebound.
Market Outlook for the Next Week
Optimistic Scenario (35% probability): Month-end institutional portfolio rebalancing concludes, and outflows from gold ETFs slow and gradually cease. Strong physical gold demand in Asia pushes gold prices back above $4,200, challenging the $4,250 resistance level.
Baseline Scenario (50% probability): Gold prices remain range-bound between $4080 and $4180. ETF selling slows, central banks continue to purchase gold to absorb excess circulating supply, the US dollar index maintains its current range, and gold prices lack a clear breakout direction.
Pessimistic Scenario (15% probability): The US dollar experiences a period of collective strength, with the euro falling below 1.1450 against the dollar and the dollar breaking through 162 against the yen, triggering a second round of concentrated selling in gold. Gold prices break below the $4080 support level and test the key low of $3950. Triggering factors: Hawkish statements from the Federal Reserve and an unexpected interest rate hike by the Bank of Japan.
Momentum traders triggered collective stop-loss orders, exacerbating capital outflows from gold ETFs.
The main downward pressure on gold prices currently stems from the large-scale reduction in holdings of gold ETFs. Over the past two weeks, the outflow of funds from mainstream listed gold products in Europe and the US has accelerated, with daily redemptions exceeding 15 tons on several trading days. The core reason for this institutional portfolio rebalancing is margin calls and portfolio rebalancing, rather than a reversal in the market's fundamental perception of gold's safe-haven status.
The correlation between gold and real yields has broken down, further confirming that this round of decline is driven by passive liquidation rather than macroeconomic logic: the yield on 10-year US Treasury Inflation-Protected Securities (TIPS) has fallen by 22 basis points this week, but gold prices have still weakened significantly, which fully demonstrates that passive selling has dominated the market trend.
The $4,200/oz level was a solid support during the consolidation phase in May, but after gold prices broke below $4,150, this level has now become a resistance level. The next key technical support for gold is at $4,080/oz, the convergence point of the 200-day moving average. If gold prices close below $4,100, it will likely trigger stop-loss selling pressure from algorithmic trend traders—these funds have been continuously reducing their long positions after gold prices failed to hold above $4,300 this month.
Physical demand in Asia remained strong, with a clear divergence between hot and cold markets.
While funds are fleeing the paper gold market, the physical gold markets in major global consumption regions are showing a starkly different trend. The premium of gold on the Shanghai Gold Exchange over the London fixing price has widened to $18-22 per ounce, the highest level since the banking crisis in March 2025. This means that even with falling gold prices, China's demand for gold imports remains strong, primarily driven by the diversification of the People's Bank of China's foreign exchange reserves and residents' safe-haven demand for gold during the domestic real estate adjustment cycle.
The Indian market also demonstrated strong resilience, with the spot gold premium narrowing from a discount of $5 per ounce last month to near parity. Consumer demand during India's wedding season, coupled with central bank gold purchases, has effectively absorbed circulating inventory. Over the past three weeks, the Reserve Bank of India has added 8 tons of gold reserves, a typical move under the trend of de-dollarization among emerging market central banks.
The divergence between the paper gold and physical gold markets has created potential bottom support for gold prices. ETF outflows typically subside gradually after a peak, lasting four to six weeks, at which point strong physical buying will once again dominate market trends. However, short-term risks remain: passive selling in the futures market could suppress the physical gold premium, forcing prices in both markets to converge, thereby weakening the current physical support logic.
A stronger dollar coupled with the unwinding of yen carry trades put further downward pressure on gold prices.
The USD/JPY exchange rate climbed to 160.38, further complicating the future trend of gold. Historically, yen depreciation has often been accompanied by a decline in gold prices—Japanese retail investors are the core holders of Asian gold ETFs, and when the yen depreciates, investors typically sell gold to hedge against the risk of their domestic currency depreciation. The recent slight increase of 0.13% in the USD/JPY exchange rate, coinciding with gold prices hitting an intraday low, further confirms the inverse correlation between the two.
More concerning is the risk of unwinding yen carry trades. The USD/JPY exchange rate is currently approaching the 161 level, a point that triggered intervention by the Bank of Japan in the foreign exchange market in April. If the yen experiences a sudden and significant rebound, gold prices may reverse course in tandem. A 3% to 5% appreciation in the yen would likely force gold speculative long positions to be liquidated, further amplifying downward pressure on gold prices.
Currently, the annualized rate of perpetual swap funding in the over-the-counter market is -0.03%, indicating that leveraged funds have generally shifted to short positions. Historical data shows that after such an extreme positioning structure, there is often a price rebound triggered by short covering.
Silver's relatively resilient price movement is sending an important tactical signal.
In this round of precious metal correction, silver showed remarkable resilience: it fell 0.89% intraday to $64.71 per ounce, far outperforming gold's 3.24% drop. The gold-silver ratio surged to 63.7, approaching the upper limit of its six-month range. Such a sharp rise in the ratio typically occurs during periods of concentrated institutional selling—gold, with its higher institutional holdings, often bears the main selling pressure during downturns. Once the ratio stabilizes, silver usually outperforms gold in subsequent rebounds.
Furthermore, silver enjoys industrial demand support that gold lacks, with rigid industrial demand from sectors such as photovoltaic manufacturing and 5G infrastructure continuously supporting silver prices. Meanwhile, West Texas Intermediate (WTI) crude oil prices rose 2.80% to $90.67 per barrel, and higher energy prices will drive increased investment in the new energy industry, further benefiting industrial demand for silver. This cross-asset correlation suggests that gold's recent decline has already shown signs of being oversold compared to other similar monetary metals.
The $4,000 mark becomes a key defense line
(Spot gold daily chart source: FX678)
Off-exchange data shows that in the past 72 hours, selling pressure on gold has been concentrated at the two key levels of $4,150 and $4,100. Passive buying has been accumulating in the $4,080 to $4,100 range, and algorithmic market makers are prepared to absorb market selling pressure in this range.
If gold prices decisively break below $4,080, the next target will be $3,950, which is the low point in February 2026 and the starting point for the previous rally to $4,350. However, realizing this pessimistic scenario requires the dual support of a sustained strong dollar and continued outflows from ETFs. In the short term, the more probable scenario is for gold prices to consolidate within the $4,080 to $4,200 range, with physical buying providing a floor and ETF selling pressure limiting any potential rebound.
Market Outlook for the Next Week
Optimistic Scenario (35% probability): Month-end institutional portfolio rebalancing concludes, and outflows from gold ETFs slow and gradually cease. Strong physical gold demand in Asia pushes gold prices back above $4,200, challenging the $4,250 resistance level.
Baseline Scenario (50% probability): Gold prices remain range-bound between $4080 and $4180. ETF selling slows, central banks continue to purchase gold to absorb excess circulating supply, the US dollar index maintains its current range, and gold prices lack a clear breakout direction.
Pessimistic Scenario (15% probability): The US dollar experiences a period of collective strength, with the euro falling below 1.1450 against the dollar and the dollar breaking through 162 against the yen, triggering a second round of concentrated selling in gold. Gold prices break below the $4080 support level and test the key low of $3950. Triggering factors: Hawkish statements from the Federal Reserve and an unexpected interest rate hike by the Bank of Japan.
- Risk Warning and Disclaimer
- The market involves risk, and trading may not be suitable for all investors. This article is for reference only and does not constitute personal investment advice, nor does it take into account certain users’ specific investment objectives, financial situation, or other needs. Any investment decisions made based on this information are at your own risk.