Why is the rise in crude oil prices failing to lift silver prices? The gold-silver ratio reveals a key signal.
2026-06-11 12:03:52
On Thursday (June 11) during the Asian session, spot silver and gold maintained a wide range of fluctuations, currently trading around $63.50 per ounce, while spot gold is trading around $4070 per ounce.
The gold-silver ratio is currently hovering around 64, failing to confirm the recent upward momentum of silver. This divergence is sending a warning signal to tactical traders.
According to the daily chart of spot silver, the overall trend is clearly weak and downward, with the bears in control.
From the perspective of the moving average system, the current price has fallen below key moving averages such as MA20, MA50, and MA200, and all moving averages have turned downwards, forming a typical bearish pattern, which continues to suppress the price, and there are no obvious signs of stabilization in the short term.
From a key price level analysis, the price has broken below the previous consolidation range and is currently around 63.3. The next target is the low of 61.48, followed by strong support at 60.96. A break below this level would open up further downside potential. The upside resistance levels are: 66.70, the 68 level near the 200-day moving average (MA200), the 73-75 range where the MA20 and MA50 intersect, and the 78-80 area, the upper edge of the previous consolidation range. Each resistance level during a rebound could become a point where short sellers re-enter the market.
From the candlestick pattern, the recent consecutive negative candlesticks indicate strong downward momentum and weak rebounds, representing a typical breakdown and downward trend, with market sentiment leaning bearish.
In summary, spot silver is currently in a weak channel on the daily chart. Given the supporting fundamentals, it is highly likely to continue its downward trend in the short term. The recommended strategy is to sell on rallies, focusing on the effectiveness of the support level in the 61.48-60.96 range. A break below this level with significant volume warrants caution regarding further downside risk. Conversely, if prices rebound, the 200-day moving average (MA200) will act as a key resistance level; only consider shorting after confirming resistance there.
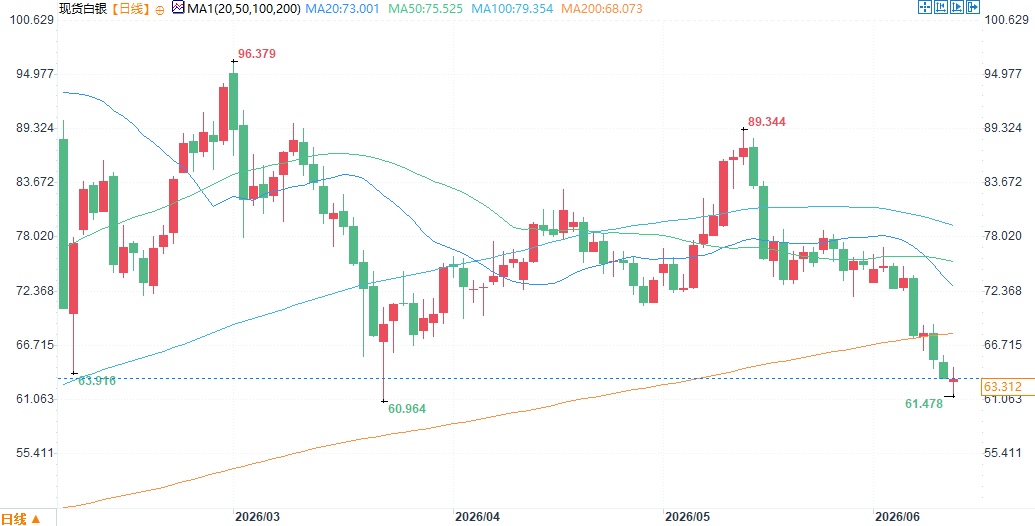
(Spot silver daily chart, source: EasyForex)
The gold-silver ratio is currently stuck in a narrow range of 62.5 to 65.5, a consolidation pattern that has lasted for eight trading days. Historically, a sustained break below 62.5 has signaled a structurally stronger phase for silver – often a precursor to a 10% to 15% increase in silver relative to gold. Conversely, a rebound from the current level towards 65.5 would indicate that the narrative of industrial demand for silver is being suppressed by safe-haven buying of gold.
It's worth noting that the recent rise in crude oil prices should theoretically benefit silver's industrial properties, but the gold-silver ratio has not fallen below 62.5. Instead, it has repeatedly tested the 63-64 range. This phenomenon suggests that the market's optimism regarding industrial demand may have been fully priced in, or that speculative positions are too crowded, and any slight disturbance could cause the ratio to move towards the upper end of the range.
For silver, the recent support zone is between $60 and $60.96, corresponding to the March lows. A break below $60.96 would open the way for a further drop to $60.
On the upside, there are layers of resistance levels: around $66 (the previous breakout level, which has now become resistance after a pullback test), followed by $68.7 (the 200-day moving average).
Regarding the gold-silver ratio, a break above 65.0 would confirm the bearish momentum of silver relative to gold, while a break below 62.5 would indicate a return to relative strength for silver.
The USD/JPY exchange rate climbed to around 160.50, posing a hidden headwind to dollar-denominated silver. A stronger yen carry trade often suppresses dollar-denominated commodities, and silver's sensitivity to industrial activity makes it more sensitive to exchange rate fluctuations than gold.
Meanwhile, the euro edged up to 1.1545 against the dollar, offering little relief as the dollar index remained resilient overall.
Scenario 1: Baseline Scenario (55% probability) – Silver holds above $63, the gold-silver ratio oscillates between 63.0 and 64.5, and the market enters a consolidation phase. This would allow momentum indicators to reset before testing the $66 resistance level.
Scenario 2: Bearish Scenario (30% probability) – A drop below $63 triggers stop-loss selling, with silver targeting $62.50. The gold-silver ratio rises above 65.0, confirming that silver's beta relative to gold is declining. This aligns with the safe-haven rotation – gold outperforms due to safe-haven inflows, while concerns about industrial demand suppress silver.
Scenario 3: Bullish Scenario (15% probability) – Silver recovers to $65.50 within two trading days, driven by a rapid drop in the gold-silver ratio below 62.5. This requires a catalyst, such as better-than-expected Chinese industrial data or a surprise dovish turn from the Federal Reserve. Given the current stance of the Federal Reserve, this is the least likely path.
At 12:02 Beijing time on June 11, spot silver was trading at $63.49 per ounce.
The gold-silver ratio is currently hovering around 64, failing to confirm the recent upward momentum of silver. This divergence is sending a warning signal to tactical traders.
The rebound was weak.
According to the daily chart of spot silver, the overall trend is clearly weak and downward, with the bears in control.
From the perspective of the moving average system, the current price has fallen below key moving averages such as MA20, MA50, and MA200, and all moving averages have turned downwards, forming a typical bearish pattern, which continues to suppress the price, and there are no obvious signs of stabilization in the short term.
From a key price level analysis, the price has broken below the previous consolidation range and is currently around 63.3. The next target is the low of 61.48, followed by strong support at 60.96. A break below this level would open up further downside potential. The upside resistance levels are: 66.70, the 68 level near the 200-day moving average (MA200), the 73-75 range where the MA20 and MA50 intersect, and the 78-80 area, the upper edge of the previous consolidation range. Each resistance level during a rebound could become a point where short sellers re-enter the market.
From the candlestick pattern, the recent consecutive negative candlesticks indicate strong downward momentum and weak rebounds, representing a typical breakdown and downward trend, with market sentiment leaning bearish.
In summary, spot silver is currently in a weak channel on the daily chart. Given the supporting fundamentals, it is highly likely to continue its downward trend in the short term. The recommended strategy is to sell on rallies, focusing on the effectiveness of the support level in the 61.48-60.96 range. A break below this level with significant volume warrants caution regarding further downside risk. Conversely, if prices rebound, the 200-day moving average (MA200) will act as a key resistance level; only consider shorting after confirming resistance there.
(Spot silver daily chart, source: EasyForex)
Gold-Silver Ratio: A Signal That Cannot Be Ignored
The gold-silver ratio is currently stuck in a narrow range of 62.5 to 65.5, a consolidation pattern that has lasted for eight trading days. Historically, a sustained break below 62.5 has signaled a structurally stronger phase for silver – often a precursor to a 10% to 15% increase in silver relative to gold. Conversely, a rebound from the current level towards 65.5 would indicate that the narrative of industrial demand for silver is being suppressed by safe-haven buying of gold.
It's worth noting that the recent rise in crude oil prices should theoretically benefit silver's industrial properties, but the gold-silver ratio has not fallen below 62.5. Instead, it has repeatedly tested the 63-64 range. This phenomenon suggests that the market's optimism regarding industrial demand may have been fully priced in, or that speculative positions are too crowded, and any slight disturbance could cause the ratio to move towards the upper end of the range.
Key support and resistance levels
For silver, the recent support zone is between $60 and $60.96, corresponding to the March lows. A break below $60.96 would open the way for a further drop to $60.
On the upside, there are layers of resistance levels: around $66 (the previous breakout level, which has now become resistance after a pullback test), followed by $68.7 (the 200-day moving average).
Regarding the gold-silver ratio, a break above 65.0 would confirm the bearish momentum of silver relative to gold, while a break below 62.5 would indicate a return to relative strength for silver.
Cross-asset dynamics and the US dollar factor
The USD/JPY exchange rate climbed to around 160.50, posing a hidden headwind to dollar-denominated silver. A stronger yen carry trade often suppresses dollar-denominated commodities, and silver's sensitivity to industrial activity makes it more sensitive to exchange rate fluctuations than gold.
Meanwhile, the euro edged up to 1.1545 against the dollar, offering little relief as the dollar index remained resilient overall.
Tactical Scenario Outlook
Scenario 1: Baseline Scenario (55% probability) – Silver holds above $63, the gold-silver ratio oscillates between 63.0 and 64.5, and the market enters a consolidation phase. This would allow momentum indicators to reset before testing the $66 resistance level.
Scenario 2: Bearish Scenario (30% probability) – A drop below $63 triggers stop-loss selling, with silver targeting $62.50. The gold-silver ratio rises above 65.0, confirming that silver's beta relative to gold is declining. This aligns with the safe-haven rotation – gold outperforms due to safe-haven inflows, while concerns about industrial demand suppress silver.
Scenario 3: Bullish Scenario (15% probability) – Silver recovers to $65.50 within two trading days, driven by a rapid drop in the gold-silver ratio below 62.5. This requires a catalyst, such as better-than-expected Chinese industrial data or a surprise dovish turn from the Federal Reserve. Given the current stance of the Federal Reserve, this is the least likely path.
At 12:02 Beijing time on June 11, spot silver was trading at $63.49 per ounce.
- Risk Warning and Disclaimer
- The market involves risk, and trading may not be suitable for all investors. This article is for reference only and does not constitute personal investment advice, nor does it take into account certain users’ specific investment objectives, financial situation, or other needs. Any investment decisions made based on this information are at your own risk.