Walsh's debut is the ultimate stress test: the 4.50% mark for the 10-year yield, will the bulls dare to push for one last move?
2026-06-17 20:09:11
On Wednesday (June 17), market focus was entirely on the Federal Reserve's June monetary policy meeting, Warsh's first policy meeting since taking office as chairman. The interest rate decision, policy statement, and Summary of Economic Projections (SEP) will be released at 2:00 AM Beijing time, followed by Warsh's first press conference at 2:30 AM. The market widely expects the target range for the federal funds rate to remain unchanged, but the core suspense lies in the possibility that internal discussions within the Fed may be far more hawkish than the final statement suggests. The US dollar index rose slightly, the euro fell back to around 1.1591 against the dollar, and the pound weakened to 1.340 due to stable UK inflation data. The 10-year US Treasury yield is currently trading at 4.442%, testing key technical levels after rebounding from a low of 4.419%, while the 2-year yield touched the upper Bollinger Band at 4.065%, showing a stronger rebound at the short end. The prevailing market view is that the key to this meeting is not the interest rate decision itself, but rather the potential signals of policy framework adjustments from Warsh and changes in his wording regarding the assessment of inflation risks.

Today's meeting may reveal a reality that the market has not yet fully priced in: the hawkish tone in internal Fed discussions is significantly higher than the publicly stated stance . According to the latest inflation data, May's CPI, PPI, and import price index all point to a potential re-acceleration of core PCE to 3.5% year-on-year, a reading well above the Fed's 2% target. Policymakers are increasingly concerned that the energy shock triggered by the situation in Iran will not be confined to overall inflation but will permeate core inflation components through transportation, production, and broader pricing channels.
Against this backdrop, the SEP forecast is expected to undergo significant adjustments this year. The median point plot is highly likely to shift from one rate cut this year to no change, and even the possibility of individual members proposing a rate hike cannot be ruled out. The median interest rate forecast for 2027 may also indicate extremely limited room for rate cuts. More noteworthy is the possibility that the long-term neutral interest rate forecast may be revised upward again to 3.25%, reflecting persistent inflationary pressures and the rising trend of global risk-free interest rates, led by Japan. At the same time, the unemployment rate forecast is expected to be revised downward, while the core PCE forecast is expected to be revised upward to at least 2.9%, which effectively suggests that the inflation target may have been raised to around 3% . This will reinforce a core argument: simply maintaining the current interest rate in a rising inflation environment already constitutes de facto easing.
Warsh himself has previously publicly criticized the Federal Reserve for excessive transparency, and this meeting may mark the beginning of his push to reduce forward guidance and weaken the policy signaling role of the dot plot. If the statement removes phrases like "additional adjustments" that hint at future rate cuts, or even completely eliminates forward guidance, it will signify a shift by the Fed to a more flexible hawkish stance. The prevailing market view is that money market pricing currently reflects an approximately 80% probability of a rate hike this year, but long-term yields have not yet fully priced this in. If the 10-year yield stabilizes above 4.50%, it will be the first confirmation of this hawkish pricing.
From the perspective of crude oil, the physical market and the futures market are sending drastically different signals. The futures curve indicates a gradual price decline, but commercial crude oil and refined product inventories are at historically low levels, and the entire supply chain—from refiners and distributors to end consumers—is structurally "shorting" inventories. After finding support at the $70 level, WTI has the technical potential to fill the gap between $82.42 and $83.20. Even if a ceasefire agreement is signed in the Strait of Hormuz, the normalization of logistics will be a slow process, and Iran's insistence on imposing a "maritime service fee" after a 60-day free passage period could be the trigger for the agreement's collapse. The structural scarcity in the physical market is providing additional inflation risk premium support for yields .
The reference contract is the 60-minute chart of the 10-year US Treasury yield. The current price is 4.442%, trading between the Bollinger Band middle line (4.433%) and the upper line (4.450%). The MACD histogram is positive, and the DIFF line remains above the DEA line, indicating that bearish momentum has significantly weakened, and bullish forces are accumulating. Key short-term trading ranges to watch:
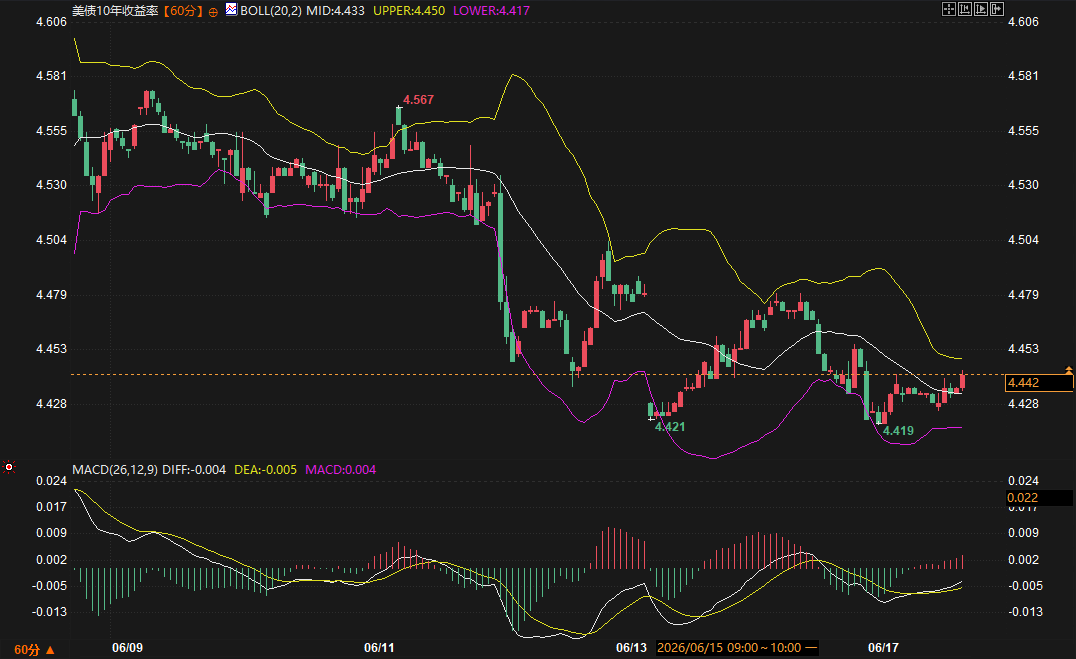
Upper resistance zone : 4.450% (Upper Bollinger Band) - 4.50% (8-day moving average trading axis). A decisive break above 4.50% would open up upside potential to the 4.567% high, which is also the starting point of the previous downtrend. Lower support zone : 4.433% (Middle Bollinger Band) - 4.417% (Lower Bollinger Band and 50-day moving average at 4.418%). The middle Bollinger Band is a key intraday level for determining whether the rebound can continue; a break below it suggests the rebound has failed and a retest of the 4.419% low is likely.
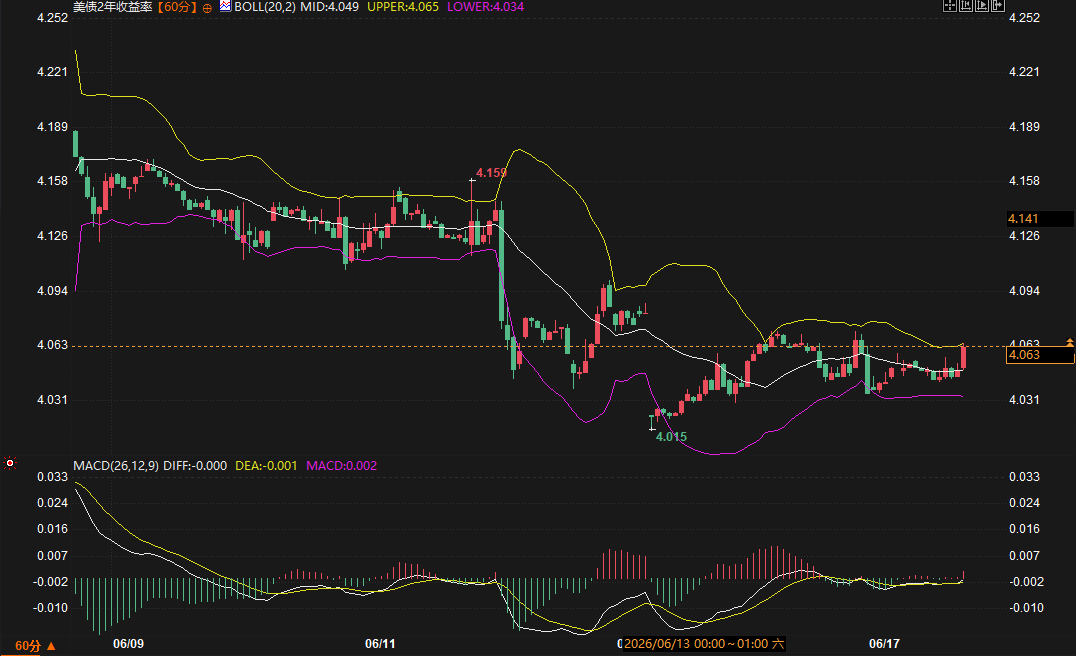
Regarding the 2-year yield, it is currently trading at 4.063%, closely following the upper Bollinger Band at 4.065%. The MACD's DIFF and DEA lines are about to form a golden cross, and the momentum bars are turning positive. The short-term bullish trend is becoming more pronounced, with a target of the previous high of 4.159% after breaking through 4.065%. Support is seen at the middle Bollinger Band at 4.049%. The term spread between the two yield curves remains within the normal positive range of around 38 basis points, indicating that the market has not priced in an economic recession, providing background support for the overall yield increase.
Key time points during the trading session are the policy statement released at 2:00 AM and the press conference at 2:30 AM. Subtle changes in the wording of the statement—especially whether it retains the dovish stance—will directly trigger an attempt to break through the 4.450% resistance level in the 10-year yield. At the press conference, attention should be paid to Warsh's comments on the upside risks to inflation and his assessment of the credibility of the dot plot.
In the next 24 to 48 hours, the movement of the 10-year US Treasury yield will depend on the extent to which the Fed's hawkish stance is realized. In the baseline scenario, if the statement removes its dovish bias and the dot plot indicates no rate cuts this year, the yield is expected to stabilize above 4.45% and challenge the psychological level of 4.50%. If Warsh releases a clearer warning about rate hikes or hints at reducing forward guidance, it will push the yield higher to the 4.56% area. The downside risk lies in the market already priced in some hawkish expectations. If the statement retains the "wait and see" wording, there may be a brief pullback due to "buy the rumor, sell the fact," but the 4.41% to 4.40% range is expected to provide effective support. The stability of oil prices at the low of $70 constitutes an additional variable; any setbacks in the implementation details of the agreement will further support long-term yields through inflation expectations.
Why were the Fed’s internal discussions more hawkish than the final statement?
The Fed under Warsh's leadership may adopt a strategy of reducing public disagreement and shortening forward guidance. The statement tends to maintain consensus, but the SEP dot plot and internal discussion minutes reveal real concerns about renewed inflation. Factors such as core PCE moving towards 3.5%, a resilient labor market, and the energy shock penetrating core inflation have forced most members to favor a tighter stance in private discussions, but the wording of the statement may be adjusted gradually to avoid sharp market volatility.
Why is a 10-year yield of 4.50% a key price level?
4.50% is the 8-day moving average trading pivot point and also the first significant technical resistance level since the pullback from the 4.567% high. A break above this level would confirm that the rebound has upgraded from a short-term correction to a trend-upward movement. Simultaneously, this is a psychological equilibrium point for the market ahead of the Fed's decision; if news triggers a valid breakout, it will attract trend-following buying, pushing yields closer to previous highs.
How does the divergence between signals from the physical crude oil market and the futures market affect US Treasury bonds?
While the futures market is pricing in equilibrium, the structural scarcity of inventory in the physical market means that the actual supply elasticity is far lower than what the futures curve suggests. Any supply disruption will be transmitted to inflation expectations through price spikes, thereby pushing up the inflation risk premium in US Treasury yields. This is one of the underlying logics supporting the "easier to rise than fall" nature of long-term yields.
How will Warsh's attitude toward forward guidance affect the market?
Warsh previously argued that the Federal Reserve was overly transparent, favoring reduced public statements and a weakening of the dot plot's role. If this meeting begins to move in this direction, reducing explicit commitments to the future path of interest rates, the market will have to rely more on data to infer policy direction. This uncertainty itself will push up term premiums, putting upward pressure on long-term yields.
Why did the 2-year yield lead the rebound in this rally?
The 2-year yield is most sensitive to changes in monetary policy expectations. The market is pricing in an 80% probability of an interest rate hike this year, with the short end directly reflecting the repricing of this risk. Technically, it has already reached the upper Bollinger Band, and a MACD golden cross is imminent. This leading upward trend indicates that the market is rapidly digesting expectations that the Federal Reserve may abandon its easing stance and shift to a neutral or even tightening position. If the probability of a rate hike increases further, the 2-year yield will be the first to break through the previous high of 4.159%.
The hawkish undertones within the Federal Reserve and the evolution of its inflation logic
Today's meeting may reveal a reality that the market has not yet fully priced in: the hawkish tone in internal Fed discussions is significantly higher than the publicly stated stance . According to the latest inflation data, May's CPI, PPI, and import price index all point to a potential re-acceleration of core PCE to 3.5% year-on-year, a reading well above the Fed's 2% target. Policymakers are increasingly concerned that the energy shock triggered by the situation in Iran will not be confined to overall inflation but will permeate core inflation components through transportation, production, and broader pricing channels.
Against this backdrop, the SEP forecast is expected to undergo significant adjustments this year. The median point plot is highly likely to shift from one rate cut this year to no change, and even the possibility of individual members proposing a rate hike cannot be ruled out. The median interest rate forecast for 2027 may also indicate extremely limited room for rate cuts. More noteworthy is the possibility that the long-term neutral interest rate forecast may be revised upward again to 3.25%, reflecting persistent inflationary pressures and the rising trend of global risk-free interest rates, led by Japan. At the same time, the unemployment rate forecast is expected to be revised downward, while the core PCE forecast is expected to be revised upward to at least 2.9%, which effectively suggests that the inflation target may have been raised to around 3% . This will reinforce a core argument: simply maintaining the current interest rate in a rising inflation environment already constitutes de facto easing.
Warsh himself has previously publicly criticized the Federal Reserve for excessive transparency, and this meeting may mark the beginning of his push to reduce forward guidance and weaken the policy signaling role of the dot plot. If the statement removes phrases like "additional adjustments" that hint at future rate cuts, or even completely eliminates forward guidance, it will signify a shift by the Fed to a more flexible hawkish stance. The prevailing market view is that money market pricing currently reflects an approximately 80% probability of a rate hike this year, but long-term yields have not yet fully priced this in. If the 10-year yield stabilizes above 4.50%, it will be the first confirmation of this hawkish pricing.
From the perspective of crude oil, the physical market and the futures market are sending drastically different signals. The futures curve indicates a gradual price decline, but commercial crude oil and refined product inventories are at historically low levels, and the entire supply chain—from refiners and distributors to end consumers—is structurally "shorting" inventories. After finding support at the $70 level, WTI has the technical potential to fill the gap between $82.42 and $83.20. Even if a ceasefire agreement is signed in the Strait of Hormuz, the normalization of logistics will be a slow process, and Iran's insistence on imposing a "maritime service fee" after a 60-day free passage period could be the trigger for the agreement's collapse. The structural scarcity in the physical market is providing additional inflation risk premium support for yields .
Technical Analysis: Support and Resistance Zones and Key Intraday Focus Areas
The reference contract is the 60-minute chart of the 10-year US Treasury yield. The current price is 4.442%, trading between the Bollinger Band middle line (4.433%) and the upper line (4.450%). The MACD histogram is positive, and the DIFF line remains above the DEA line, indicating that bearish momentum has significantly weakened, and bullish forces are accumulating. Key short-term trading ranges to watch:
Upper resistance zone : 4.450% (Upper Bollinger Band) - 4.50% (8-day moving average trading axis). A decisive break above 4.50% would open up upside potential to the 4.567% high, which is also the starting point of the previous downtrend. Lower support zone : 4.433% (Middle Bollinger Band) - 4.417% (Lower Bollinger Band and 50-day moving average at 4.418%). The middle Bollinger Band is a key intraday level for determining whether the rebound can continue; a break below it suggests the rebound has failed and a retest of the 4.419% low is likely.
Regarding the 2-year yield, it is currently trading at 4.063%, closely following the upper Bollinger Band at 4.065%. The MACD's DIFF and DEA lines are about to form a golden cross, and the momentum bars are turning positive. The short-term bullish trend is becoming more pronounced, with a target of the previous high of 4.159% after breaking through 4.065%. Support is seen at the middle Bollinger Band at 4.049%. The term spread between the two yield curves remains within the normal positive range of around 38 basis points, indicating that the market has not priced in an economic recession, providing background support for the overall yield increase.
Key time points during the trading session are the policy statement released at 2:00 AM and the press conference at 2:30 AM. Subtle changes in the wording of the statement—especially whether it retains the dovish stance—will directly trigger an attempt to break through the 4.450% resistance level in the 10-year yield. At the press conference, attention should be paid to Warsh's comments on the upside risks to inflation and his assessment of the credibility of the dot plot.
Short-term outlook
In the next 24 to 48 hours, the movement of the 10-year US Treasury yield will depend on the extent to which the Fed's hawkish stance is realized. In the baseline scenario, if the statement removes its dovish bias and the dot plot indicates no rate cuts this year, the yield is expected to stabilize above 4.45% and challenge the psychological level of 4.50%. If Warsh releases a clearer warning about rate hikes or hints at reducing forward guidance, it will push the yield higher to the 4.56% area. The downside risk lies in the market already priced in some hawkish expectations. If the statement retains the "wait and see" wording, there may be a brief pullback due to "buy the rumor, sell the fact," but the 4.41% to 4.40% range is expected to provide effective support. The stability of oil prices at the low of $70 constitutes an additional variable; any setbacks in the implementation details of the agreement will further support long-term yields through inflation expectations.
Frequently Asked Questions
Why were the Fed’s internal discussions more hawkish than the final statement?
The Fed under Warsh's leadership may adopt a strategy of reducing public disagreement and shortening forward guidance. The statement tends to maintain consensus, but the SEP dot plot and internal discussion minutes reveal real concerns about renewed inflation. Factors such as core PCE moving towards 3.5%, a resilient labor market, and the energy shock penetrating core inflation have forced most members to favor a tighter stance in private discussions, but the wording of the statement may be adjusted gradually to avoid sharp market volatility.
Why is a 10-year yield of 4.50% a key price level?
4.50% is the 8-day moving average trading pivot point and also the first significant technical resistance level since the pullback from the 4.567% high. A break above this level would confirm that the rebound has upgraded from a short-term correction to a trend-upward movement. Simultaneously, this is a psychological equilibrium point for the market ahead of the Fed's decision; if news triggers a valid breakout, it will attract trend-following buying, pushing yields closer to previous highs.
How does the divergence between signals from the physical crude oil market and the futures market affect US Treasury bonds?
While the futures market is pricing in equilibrium, the structural scarcity of inventory in the physical market means that the actual supply elasticity is far lower than what the futures curve suggests. Any supply disruption will be transmitted to inflation expectations through price spikes, thereby pushing up the inflation risk premium in US Treasury yields. This is one of the underlying logics supporting the "easier to rise than fall" nature of long-term yields.
How will Warsh's attitude toward forward guidance affect the market?
Warsh previously argued that the Federal Reserve was overly transparent, favoring reduced public statements and a weakening of the dot plot's role. If this meeting begins to move in this direction, reducing explicit commitments to the future path of interest rates, the market will have to rely more on data to infer policy direction. This uncertainty itself will push up term premiums, putting upward pressure on long-term yields.
Why did the 2-year yield lead the rebound in this rally?
The 2-year yield is most sensitive to changes in monetary policy expectations. The market is pricing in an 80% probability of an interest rate hike this year, with the short end directly reflecting the repricing of this risk. Technically, it has already reached the upper Bollinger Band, and a MACD golden cross is imminent. This leading upward trend indicates that the market is rapidly digesting expectations that the Federal Reserve may abandon its easing stance and shift to a neutral or even tightening position. If the probability of a rate hike increases further, the 2-year yield will be the first to break through the previous high of 4.159%.
- Risk Warning and Disclaimer
- The market involves risk, and trading may not be suitable for all investors. This article is for reference only and does not constitute personal investment advice, nor does it take into account certain users’ specific investment objectives, financial situation, or other needs. Any investment decisions made based on this information are at your own risk.