US Dollar Index Analysis: Rising interest rate hike expectations and multiple positive factors combined to drive the US dollar index to a strong upward surge.
2026-06-24 01:36:56
The global financial market landscape has recently diverged significantly. The US dollar, strongly supported by expectations of a Federal Reserve rate hike, has experienced an independent upward trend. Its safe-haven appeal and monetary policy premium have combined to propel the dollar index higher, making it the most eye-catching asset in the market. Since the conclusion of the first Federal Open Market Committee (FOMC) meeting, attended by Federal Reserve official Kevin Warsh, the trading logic in financial markets has completely shifted to pricing in interest rate hikes, with most institutions and investors beginning to fully price in the possibility of a Fed rate hike this year.
Currently, risk aversion and interest rate hike sentiment are intensifying in the global foreign exchange market. Market expectations for a Federal Reserve rate hike this year are rapidly rising, and multiple positive factors have combined to propel the US dollar index (DXY) to a strong surge, successfully holding above the key psychological level of 101 and reaching a new high in 13 months. Changes in expectations regarding the Federal Reserve's monetary policy are the core driver of this round of dollar strength. The market's pricing of a continued increase in the probability of a rate hike has directly boosted the attractiveness of dollar assets, driving the dollar index into a period of strength. The overall short-term bullish pattern is clear, and the medium- to long-term upward trend is gradually building momentum.
Federal Reserve interest rate hike expectations and the trend of US Treasury yields
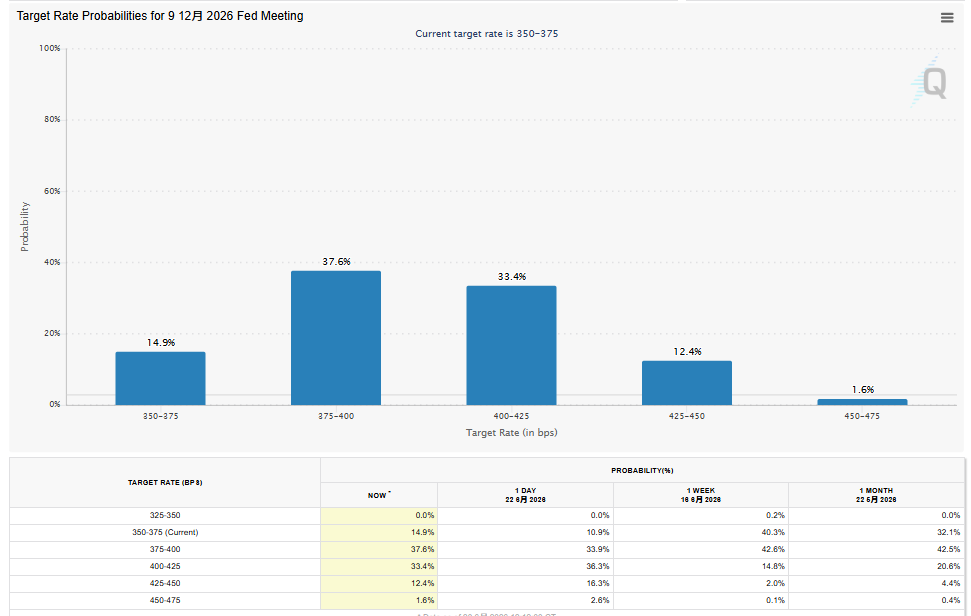
The market generally anticipates that the Federal Reserve will likely implement a 25-basis-point interest rate hike before the end of 2026. This move would raise the federal funds rate from the current 3.75% to the 4.00% range, and the expectation of a marginal tightening of monetary policy continues to solidify the foundation for the dollar's rise. Driven by this expectation, short-term US Treasury yields have risen sharply first, with the 2-year Treasury yield repeatedly hitting new highs for 2026. In contrast, the yields of 10-year and 30-year long-term US Treasury bonds have lagged behind, showing a clear divergence in yield trends between short and long-term maturities. This is also a significant factor contributing to the recent structural strengthening of the dollar index.
This structural divergence in US Treasury yields provides strong support for the short-term trend of the US dollar index and directly establishes the short-term bullish tone of the dollar. However, from the overall trend, the current market has not yet confirmed the start of a long-term comprehensive bull market for the dollar, but is only a phase of structural rise. Further confirmation of the trend's continuation still requires the support of long-term yields.
Key trading levels for the US Dollar Index
From the key monitoring points on the core trading board, the US dollar index shows a clear range and expected rise and fall: if the US dollar index can hold firmly above the 101.30 level, the upside potential will be further opened up, and it is expected to challenge the resistance range of 102.80 to 104.50 in the short term; conversely, if the index rises and falls back and effectively breaks through the support level of 100.20, the market will usher in a phase of correction, with the key support range below at 99.30, which is also an important dividing line between the recent battle between bulls and bears.
Monthly chart technical pattern analysis
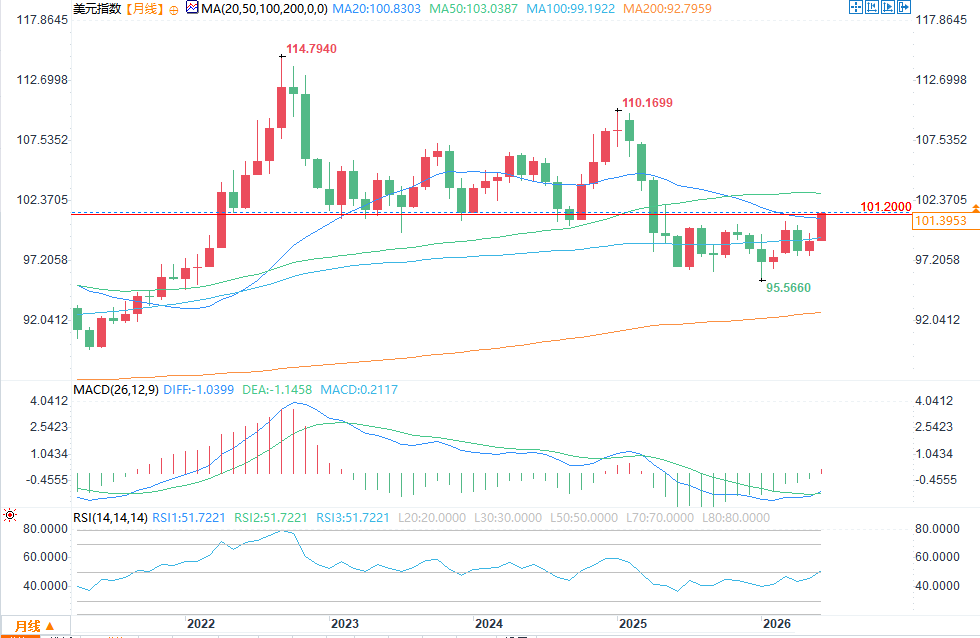
(US Dollar Index Monthly Chart Source: FX678)
From a long-term perspective of monthly logarithmic chart analysis, the 101.20 level is a crucial point determining the medium-term trend of the US dollar index, and it has strong reference value for judging market trends. From a long-term technical perspective, the US dollar index has maintained an overall upward trend since 2008, demonstrating strong resilience. Currently, the index has just reached a confluence of multiple key technical levels, indicating ample technical support.
On the one hand, the 101 level is a core support-to-resistance zone that has formed over many years since 2022, previously providing long-term bottom support for the index; once broken, it will become a strong resistance level. On the other hand, this point corresponds to the 38.2% Fibonacci retracement level of the downward wave from the 2025 high to the 2026 low, a classic technical turning point. Meanwhile, over the past year, the US dollar index has gradually formed a double bottom pattern, with 101.20 being a potential neckline. The superposition of multiple technical patterns significantly enhances the strategic significance of this level.
Subsequent market trends and related currency movements
If the US dollar index effectively breaks through the core neckline resistance level of 101.20, it will open up a new round of upward space. The first target is the 50% Fibonacci resistance level of 102.80, with a further target of the 61.8% core resistance level of 104.50. The continued strengthening of the US dollar will also put significant pressure on major non-US dollar currencies, likely pushing the GBP/USD exchange rate down to the 1.29-1.27 range, while helping the USD/JPY exchange rate continue to rise, potentially hitting the 170 level in the short term, and even having a medium- to long-term upward expectation of 180.
On the downside, if the US dollar index reverses its trend and breaks below both the 100 level and the key support level of 99.30, it would signify the end of the current short-term bullish trend, and the market would re-establish a medium-term bearish outlook for the dollar. At that point, non-US currencies and precious metals would have an opportunity for a corrective rebound, completing a reverse rotation in the market.
Currently, risk aversion and interest rate hike sentiment are intensifying in the global foreign exchange market. Market expectations for a Federal Reserve rate hike this year are rapidly rising, and multiple positive factors have combined to propel the US dollar index (DXY) to a strong surge, successfully holding above the key psychological level of 101 and reaching a new high in 13 months. Changes in expectations regarding the Federal Reserve's monetary policy are the core driver of this round of dollar strength. The market's pricing of a continued increase in the probability of a rate hike has directly boosted the attractiveness of dollar assets, driving the dollar index into a period of strength. The overall short-term bullish pattern is clear, and the medium- to long-term upward trend is gradually building momentum.
Federal Reserve interest rate hike expectations and the trend of US Treasury yields
The market generally anticipates that the Federal Reserve will likely implement a 25-basis-point interest rate hike before the end of 2026. This move would raise the federal funds rate from the current 3.75% to the 4.00% range, and the expectation of a marginal tightening of monetary policy continues to solidify the foundation for the dollar's rise. Driven by this expectation, short-term US Treasury yields have risen sharply first, with the 2-year Treasury yield repeatedly hitting new highs for 2026. In contrast, the yields of 10-year and 30-year long-term US Treasury bonds have lagged behind, showing a clear divergence in yield trends between short and long-term maturities. This is also a significant factor contributing to the recent structural strengthening of the dollar index.
This structural divergence in US Treasury yields provides strong support for the short-term trend of the US dollar index and directly establishes the short-term bullish tone of the dollar. However, from the overall trend, the current market has not yet confirmed the start of a long-term comprehensive bull market for the dollar, but is only a phase of structural rise. Further confirmation of the trend's continuation still requires the support of long-term yields.
Key trading levels for the US Dollar Index
From the key monitoring points on the core trading board, the US dollar index shows a clear range and expected rise and fall: if the US dollar index can hold firmly above the 101.30 level, the upside potential will be further opened up, and it is expected to challenge the resistance range of 102.80 to 104.50 in the short term; conversely, if the index rises and falls back and effectively breaks through the support level of 100.20, the market will usher in a phase of correction, with the key support range below at 99.30, which is also an important dividing line between the recent battle between bulls and bears.
Monthly chart technical pattern analysis
(US Dollar Index Monthly Chart Source: FX678)
From a long-term perspective of monthly logarithmic chart analysis, the 101.20 level is a crucial point determining the medium-term trend of the US dollar index, and it has strong reference value for judging market trends. From a long-term technical perspective, the US dollar index has maintained an overall upward trend since 2008, demonstrating strong resilience. Currently, the index has just reached a confluence of multiple key technical levels, indicating ample technical support.
On the one hand, the 101 level is a core support-to-resistance zone that has formed over many years since 2022, previously providing long-term bottom support for the index; once broken, it will become a strong resistance level. On the other hand, this point corresponds to the 38.2% Fibonacci retracement level of the downward wave from the 2025 high to the 2026 low, a classic technical turning point. Meanwhile, over the past year, the US dollar index has gradually formed a double bottom pattern, with 101.20 being a potential neckline. The superposition of multiple technical patterns significantly enhances the strategic significance of this level.
Subsequent market trends and related currency movements
If the US dollar index effectively breaks through the core neckline resistance level of 101.20, it will open up a new round of upward space. The first target is the 50% Fibonacci resistance level of 102.80, with a further target of the 61.8% core resistance level of 104.50. The continued strengthening of the US dollar will also put significant pressure on major non-US dollar currencies, likely pushing the GBP/USD exchange rate down to the 1.29-1.27 range, while helping the USD/JPY exchange rate continue to rise, potentially hitting the 170 level in the short term, and even having a medium- to long-term upward expectation of 180.
On the downside, if the US dollar index reverses its trend and breaks below both the 100 level and the key support level of 99.30, it would signify the end of the current short-term bullish trend, and the market would re-establish a medium-term bearish outlook for the dollar. At that point, non-US currencies and precious metals would have an opportunity for a corrective rebound, completing a reverse rotation in the market.
- Risk Warning and Disclaimer
- The market involves risk, and trading may not be suitable for all investors. This article is for reference only and does not constitute personal investment advice, nor does it take into account certain users’ specific investment objectives, financial situation, or other needs. Any investment decisions made based on this information are at your own risk.