Gold Price Analysis: Bearish Dominance, Gold Prices Decline Again on Wednesday
2026-06-25 01:11:58
On Wednesday (June 24), international gold prices continued their downward trend, with the market's movement increasingly linked to fluctuations in US interest rates. This broke the previous pattern where falling interest rates were expected to benefit gold prices, resulting in a divergence in market dynamics. Currently, gold prices are very weak, with downside risks significantly increasing, and the overall market is in a highly fragile state. Gold prices fell 2.44% to $4009.9 per ounce during the day, with bearish forces continuing to dominate the market.

Technical Analysis
During Wednesday's early trading session, international gold prices experienced a significant pullback, with concentrated selling pressure leading to a rapid weakening of the market. Gold prices are now approaching the key $4,000 level, which is not only a psychologically significant support level but also historically a core point of contention between bulls and bears. If gold prices decisively break below $4,000, the bearish trend will likely continue, with a high probability of testing support at the $3,500 level. $3,500 is a crucial historical support level for gold, where it has historically provided a point of support and stabilization during numerous downtrends, making it a valuable technical reference.
From a short-term rebound perspective, if gold prices experience a slight recovery, the $4,200 level will act as strong resistance. Currently, the market is exhibiting a stark contrast: despite the continued decline in US interest rates, gold prices, which should have been boosted, are instead falling. This unusual trend fully reflects the core logic of market sentiment; investors generally anticipate a significant drop in global inflation, and this expectation of cooling inflation has greatly weakened gold's appeal as a safe haven and hedge against inflation. This is the core reason for the counter-trend decline in gold prices.
Technical Analysis and Inflation Expectation Interpretation
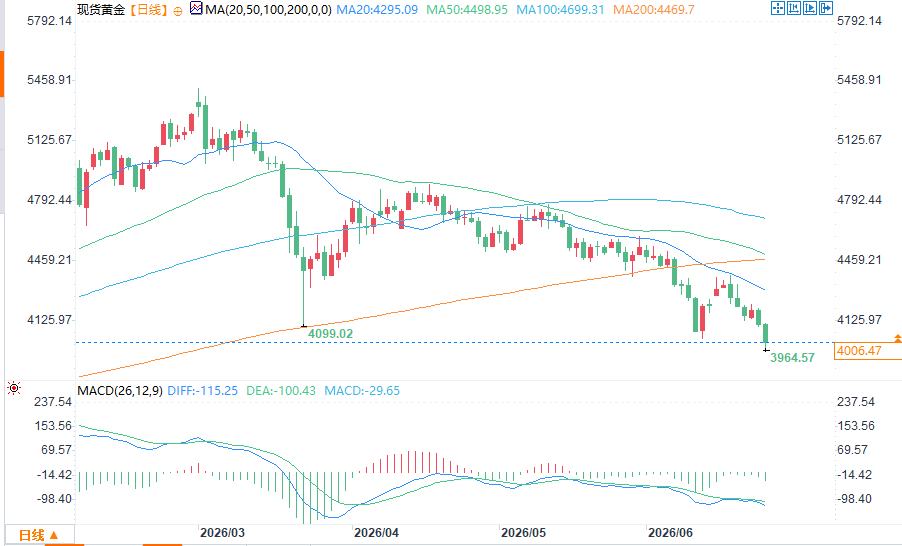
(Spot gold daily chart source: FX678)
If gold prices subsequently break below the current trading range and continue their downward trend, the $3,500 level will become a highly cost-effective support area for short-term long positions. However, it is also necessary to be wary of bearish signals from key technical indicators. The 50-day exponential moving average is rapidly converging with the 200-day exponential moving average, and a death cross is about to form. This technical pattern is a typical signal of the start of a medium- to long-term downtrend, indicating that gold prices are likely to begin a period of decline.
The gold price chart has currently formed a large rounded top pattern, a highly damaging top reversal structure. The $4,000 level is widely recognized as a crucial psychological support; a breach of this level would shatter market confidence, triggering widespread sell-offs and initiating a deep correction.
In summary, Wednesday's market movements may provide a clear answer to the future trend of gold. Currently, it's crucial to closely monitor the battle for the key support level of $4000. At this stage, it's advisable to refrain from long or short trading and maintain a wait-and-see approach. By the close of trading that day, the market will clearly show whether bullish funds are willing to enter the market to support and stabilize gold prices. Gold is currently at a critical juncture in its trend; a breakout or breakdown of this key level could very likely trigger a one-sided move of up to $500. The subsequent price action warrants close monitoring.
Technical Analysis
During Wednesday's early trading session, international gold prices experienced a significant pullback, with concentrated selling pressure leading to a rapid weakening of the market. Gold prices are now approaching the key $4,000 level, which is not only a psychologically significant support level but also historically a core point of contention between bulls and bears. If gold prices decisively break below $4,000, the bearish trend will likely continue, with a high probability of testing support at the $3,500 level. $3,500 is a crucial historical support level for gold, where it has historically provided a point of support and stabilization during numerous downtrends, making it a valuable technical reference.
From a short-term rebound perspective, if gold prices experience a slight recovery, the $4,200 level will act as strong resistance. Currently, the market is exhibiting a stark contrast: despite the continued decline in US interest rates, gold prices, which should have been boosted, are instead falling. This unusual trend fully reflects the core logic of market sentiment; investors generally anticipate a significant drop in global inflation, and this expectation of cooling inflation has greatly weakened gold's appeal as a safe haven and hedge against inflation. This is the core reason for the counter-trend decline in gold prices.
Technical Analysis and Inflation Expectation Interpretation
(Spot gold daily chart source: FX678)
If gold prices subsequently break below the current trading range and continue their downward trend, the $3,500 level will become a highly cost-effective support area for short-term long positions. However, it is also necessary to be wary of bearish signals from key technical indicators. The 50-day exponential moving average is rapidly converging with the 200-day exponential moving average, and a death cross is about to form. This technical pattern is a typical signal of the start of a medium- to long-term downtrend, indicating that gold prices are likely to begin a period of decline.
The gold price chart has currently formed a large rounded top pattern, a highly damaging top reversal structure. The $4,000 level is widely recognized as a crucial psychological support; a breach of this level would shatter market confidence, triggering widespread sell-offs and initiating a deep correction.
In summary, Wednesday's market movements may provide a clear answer to the future trend of gold. Currently, it's crucial to closely monitor the battle for the key support level of $4000. At this stage, it's advisable to refrain from long or short trading and maintain a wait-and-see approach. By the close of trading that day, the market will clearly show whether bullish funds are willing to enter the market to support and stabilize gold prices. Gold is currently at a critical juncture in its trend; a breakout or breakdown of this key level could very likely trigger a one-sided move of up to $500. The subsequent price action warrants close monitoring.
- Risk Warning and Disclaimer
- The market involves risk, and trading may not be suitable for all investors. This article is for reference only and does not constitute personal investment advice, nor does it take into account certain users’ specific investment objectives, financial situation, or other needs. Any investment decisions made based on this information are at your own risk.