After a sharp 4% drop, it finally turned red, but Dr. Copper's problems have only just begun.
2026-06-25 18:02:40
On Thursday (June 25), benchmark copper prices on the London Metal Exchange stabilized and rebounded after plunging more than 4% over two consecutive trading days, briefly rising above $13,250. According to a well-known foreign media report, bargain hunting, a slight weakening of the US dollar index from a 13-month high, and a recovery in risk appetite in global stock markets all provided a respite for copper prices. Aluminum, nickel, and other industrial metals also saw a corrective rebound, as the market attempts to digest the recent accumulation of negative macroeconomic factors.

Overnight earnings reports from global chip giants reignited trading on artificial intelligence themes, boosting equity market sentiment and temporarily halting the dollar's surge. A prominent foreign media outlet, citing an ING strategist, pointed out that copper prices recovered some lost ground, directly triggered by a weaker dollar and improved risk appetite. However, the strategist also warned that the macroeconomic backdrop remains challenging—expectations of "higher and longer" US interest rates have not dissipated, fundamentally suppressing the valuation of industrial metals. Whether bargain hunting can develop into a trend reversal depends on whether subsequent inflation data will further reinforce expectations of interest rate hikes. The current rebound is more like a tug-of-war between short-term sentiment and long-term pressure; optimism needs to be tempered with caution.
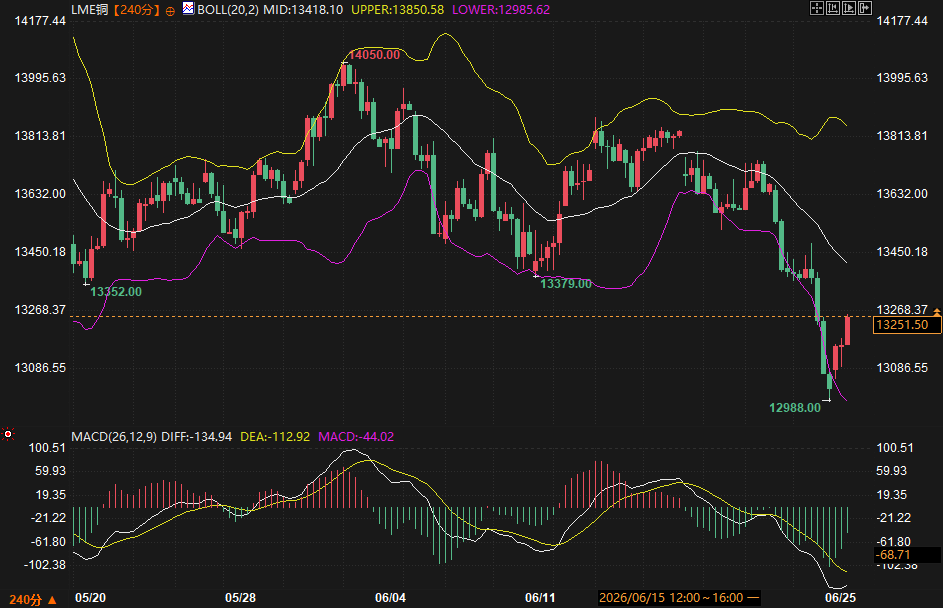
Looking at the 240-minute chart for LME copper, the signals from the market are more somber than those from the news. After rising from around 13350 to a high of 14050 in late May, prices have been sluggish, accelerating their decline in mid-June to a low of 12988, forming a typical descending channel. The Bollinger Bands have widened significantly, indicating that the trend is continuing. Currently, the price of 13251.50 is between the lower Bollinger Band (12985.62) and the middle Bollinger Band (13418.10), placing it precisely in a weak zone.
The MACD indicator's fast and slow lines have both sunk below the zero line, and the DIFF is below the DEA, maintaining a bearish alignment. The latest green bars are not only not narrowing, but are still expanding, indicating that bearish momentum has not yet exhausted itself. Under this technical structure, as long as the price fails to effectively recover the middle Bollinger Band at 13418, any intraday rallies are easily seen as corrective pullbacks within a bearish pattern. Swing traders often focus on the strong support zone of 12985-13000, which is formed by the lower Bollinger Band and previous lows. Once this level is breached, further downside potential could open up.
Copper's sensitivity to the US dollar and interest rates was vividly demonstrated this week. On Wednesday, the US dollar index surged to a 13-month high, and LME copper fell to a recent low; on Thursday, the dollar weakened slightly, and copper prices immediately rebounded. Behind this cross-market correlation lies a shift in positioning logic—speculative funds are rapidly deleveraging in the face of macroeconomic uncertainty. Another variable worth discussing is the dissipation of geopolitical premiums. Taking aluminum as an example, a Sucden financial analyst pointed out that concerns about energy costs previously driven up by conflicts in the Middle East have given way to the narrative of "supply normalization," causing aluminum prices to give back all geopolitical premiums. While copper is more influenced by macroeconomic factors, if crude oil and energy commodities continue to cool, it's possible that the support for copper could be indirectly weakened through a cost deflationary path.
Cross-commodity data also reflects market uncertainty to some extent. Indonesia's latest statement that its 2026 nickel production quota has not yet been finalized dampened market speculation about further supply easing, leading to a slight rebound in LME nickel; zinc, lead, and tin also rose. While this recovery appears active, each commodity is still digesting the significant previous declines, and no clear independent driver is currently apparent. For copper, the real fundamental factors to consider are concentrate processing fees, inventory changes, and potential supply disruptions, but these factors have not yet undergone significant changes. With macroeconomic pressures mounting, supply-side disturbances may provide short-lived price spikes, but they are unlikely to reverse the overall trend on their own.
From the current juncture, short-term copper prices will likely continue to fluctuate within the 13000-13418 range. If the MACD histogram shortens in the next day or two and the price can hold above 13400, this correction may test the upper Bollinger Band at 13850, forming a small double bottom pattern. Conversely, if the US dollar strengthens again coupled with rising interest rate expectations, and the price breaks below the 12985 "Maginot Line," there is a high probability of triggering a new round of stop-loss orders, leading the price to seek equilibrium in a lower range. In the medium to long term, as long as the "higher and longer" interest rate curse remains, copper prices are unlikely to experience a smooth one-sided upward trend. While the strategy of buying on dips remains, market sentiment will remain cautious until a confirmation signal appears on the right side.
Why have copper prices fallen so sharply in the last two days?
This week's decline was mainly a result of the concentrated release of macroeconomic sentiment. The US dollar index surged to a 13-month high, and ahead of the release of US inflation data, market expectations for at least one more interest rate hike this year intensified, suppressing the valuation of non-interest-bearing assets like copper. Previously accumulated speculative long positions were quickly liquidated, exacerbating the short-term decline.
Is the current technical outlook bearish or is the market bottoming out?
The 240-minute chart remains in a downtrend. It's trading below the Bollinger Middle Band at 13418, the MACD histogram is expanding, and the highs and lows are continuing to decline – all typical signs of weakness. While the lower Bollinger Band area of 12985-13000 provides temporary support, a bottoming pattern can only be discussed after the price effectively recovers above the Middle Band and the histogram shows a significant narrowing.
Can a weaker dollar continue to push up copper prices?
A weaker dollar can indeed provide a positive feedback to copper prices in the short term, but whether this logic can be sustained depends on subsequent inflation and employment data. If the data supports a decline in interest rate hike expectations, the dollar may adjust further, which would be beneficial for copper; however, if inflation exceeds expectations, the dollar could strengthen again at any time, potentially interrupting the copper rebound. Essentially, it's still driven by macroeconomic data.
What is the transmission path of Middle East geopolitical situation to copper?
Unlike aluminum, copper is not directly affected by energy costs, but the situation in the Middle East is indirectly transmitted through oil prices, inflation expectations, and risk appetite. If the situation pushes up oil prices and inflation, it will strengthen tightening expectations, putting pressure on copper. Currently, the market is gradually taking back these premiums, and the risk sentiment support for copper is also diminishing.
What is the connection between the uncertainty surrounding Indonesia's nickel ore quotas and copper?
While not directly related, it serves as a window into the overall sentiment of the industrial metals market. The wavering supply policy of nickel reflects the hesitation of resource-rich countries in the face of slowing demand. This instability in the supply-side narrative could also be replicated in other metals, reminding us not to unilaterally bet on a supply contraction story. The supply-side logic for copper also needs more real-world data to verify.
The struggle between macro headwinds and short-term recovery
Overnight earnings reports from global chip giants reignited trading on artificial intelligence themes, boosting equity market sentiment and temporarily halting the dollar's surge. A prominent foreign media outlet, citing an ING strategist, pointed out that copper prices recovered some lost ground, directly triggered by a weaker dollar and improved risk appetite. However, the strategist also warned that the macroeconomic backdrop remains challenging—expectations of "higher and longer" US interest rates have not dissipated, fundamentally suppressing the valuation of industrial metals. Whether bargain hunting can develop into a trend reversal depends on whether subsequent inflation data will further reinforce expectations of interest rate hikes. The current rebound is more like a tug-of-war between short-term sentiment and long-term pressure; optimism needs to be tempered with caution.
Technical Dilemma: Key Defense Line Under Bearish Pattern
Looking at the 240-minute chart for LME copper, the signals from the market are more somber than those from the news. After rising from around 13350 to a high of 14050 in late May, prices have been sluggish, accelerating their decline in mid-June to a low of 12988, forming a typical descending channel. The Bollinger Bands have widened significantly, indicating that the trend is continuing. Currently, the price of 13251.50 is between the lower Bollinger Band (12985.62) and the middle Bollinger Band (13418.10), placing it precisely in a weak zone.
The MACD indicator's fast and slow lines have both sunk below the zero line, and the DIFF is below the DEA, maintaining a bearish alignment. The latest green bars are not only not narrowing, but are still expanding, indicating that bearish momentum has not yet exhausted itself. Under this technical structure, as long as the price fails to effectively recover the middle Bollinger Band at 13418, any intraday rallies are easily seen as corrective pullbacks within a bearish pattern. Swing traders often focus on the strong support zone of 12985-13000, which is formed by the lower Bollinger Band and previous lows. Once this level is breached, further downside potential could open up.
The triple transmission of the US dollar, interest rates, and geopolitical premiums
Copper's sensitivity to the US dollar and interest rates was vividly demonstrated this week. On Wednesday, the US dollar index surged to a 13-month high, and LME copper fell to a recent low; on Thursday, the dollar weakened slightly, and copper prices immediately rebounded. Behind this cross-market correlation lies a shift in positioning logic—speculative funds are rapidly deleveraging in the face of macroeconomic uncertainty. Another variable worth discussing is the dissipation of geopolitical premiums. Taking aluminum as an example, a Sucden financial analyst pointed out that concerns about energy costs previously driven up by conflicts in the Middle East have given way to the narrative of "supply normalization," causing aluminum prices to give back all geopolitical premiums. While copper is more influenced by macroeconomic factors, if crude oil and energy commodities continue to cool, it's possible that the support for copper could be indirectly weakened through a cost deflationary path.
Disruption indicators and unrealized supply signs
Cross-commodity data also reflects market uncertainty to some extent. Indonesia's latest statement that its 2026 nickel production quota has not yet been finalized dampened market speculation about further supply easing, leading to a slight rebound in LME nickel; zinc, lead, and tin also rose. While this recovery appears active, each commodity is still digesting the significant previous declines, and no clear independent driver is currently apparent. For copper, the real fundamental factors to consider are concentrate processing fees, inventory changes, and potential supply disruptions, but these factors have not yet undergone significant changes. With macroeconomic pressures mounting, supply-side disturbances may provide short-lived price spikes, but they are unlikely to reverse the overall trend on their own.
Trend Outlook
From the current juncture, short-term copper prices will likely continue to fluctuate within the 13000-13418 range. If the MACD histogram shortens in the next day or two and the price can hold above 13400, this correction may test the upper Bollinger Band at 13850, forming a small double bottom pattern. Conversely, if the US dollar strengthens again coupled with rising interest rate expectations, and the price breaks below the 12985 "Maginot Line," there is a high probability of triggering a new round of stop-loss orders, leading the price to seek equilibrium in a lower range. In the medium to long term, as long as the "higher and longer" interest rate curse remains, copper prices are unlikely to experience a smooth one-sided upward trend. While the strategy of buying on dips remains, market sentiment will remain cautious until a confirmation signal appears on the right side.
Frequently Asked Questions
Why have copper prices fallen so sharply in the last two days?
This week's decline was mainly a result of the concentrated release of macroeconomic sentiment. The US dollar index surged to a 13-month high, and ahead of the release of US inflation data, market expectations for at least one more interest rate hike this year intensified, suppressing the valuation of non-interest-bearing assets like copper. Previously accumulated speculative long positions were quickly liquidated, exacerbating the short-term decline.
Is the current technical outlook bearish or is the market bottoming out?
The 240-minute chart remains in a downtrend. It's trading below the Bollinger Middle Band at 13418, the MACD histogram is expanding, and the highs and lows are continuing to decline – all typical signs of weakness. While the lower Bollinger Band area of 12985-13000 provides temporary support, a bottoming pattern can only be discussed after the price effectively recovers above the Middle Band and the histogram shows a significant narrowing.
Can a weaker dollar continue to push up copper prices?
A weaker dollar can indeed provide a positive feedback to copper prices in the short term, but whether this logic can be sustained depends on subsequent inflation and employment data. If the data supports a decline in interest rate hike expectations, the dollar may adjust further, which would be beneficial for copper; however, if inflation exceeds expectations, the dollar could strengthen again at any time, potentially interrupting the copper rebound. Essentially, it's still driven by macroeconomic data.
What is the transmission path of Middle East geopolitical situation to copper?
Unlike aluminum, copper is not directly affected by energy costs, but the situation in the Middle East is indirectly transmitted through oil prices, inflation expectations, and risk appetite. If the situation pushes up oil prices and inflation, it will strengthen tightening expectations, putting pressure on copper. Currently, the market is gradually taking back these premiums, and the risk sentiment support for copper is also diminishing.
What is the connection between the uncertainty surrounding Indonesia's nickel ore quotas and copper?
While not directly related, it serves as a window into the overall sentiment of the industrial metals market. The wavering supply policy of nickel reflects the hesitation of resource-rich countries in the face of slowing demand. This instability in the supply-side narrative could also be replicated in other metals, reminding us not to unilaterally bet on a supply contraction story. The supply-side logic for copper also needs more real-world data to verify.
- Risk Warning and Disclaimer
- The market involves risk, and trading may not be suitable for all investors. This article is for reference only and does not constitute personal investment advice, nor does it take into account certain users’ specific investment objectives, financial situation, or other needs. Any investment decisions made based on this information are at your own risk.