AI frenzy fuels style shift as risk aversion subsides, gold prices fall into value range
2026-06-25 18:06:27
On Thursday (June 25), spot gold and silver experienced a sharp drop during the Asian and European sessions, with silver facing particularly heavy selling pressure.
The combined effects of a strong US dollar, a repricing of Federal Reserve interest rate expectations, and, in this article's most important factor, the global inflation expectation gap and a general decline in geopolitical risk aversion, completely offset the remaining safe-haven buying in the US-Iran geopolitical situation, causing precious metals to weaken accordingly.
This round of deep correction in gold prices is not due to a collapse in long-term fundamentals, but rather a structural adjustment triggered by the resonance of multiple short-term trading logics. Two core direct logics have dominated this round of gold price decline.
Unlike conventional commodities, gold possesses strong safe-haven financial attributes. During periods of escalating geopolitical conflict and widespread market panic, funds will massively hoard gold to meet safe-haven demand. This creates an additional geopolitical safe-haven premium on top of the commodity and currency pricing, forcibly pushing up gold prices.
Although the day the US-Iran conflict broke out was basically the peak of gold prices, it is undeniable that risk aversion did provide a buying logic for gold and there was related buying pressure. However, the overall combined force ultimately led to a downward trend in gold prices.
The turning point in this round of market trends stemmed from the substantial easing of tensions between the US and Iran, with both sides reaching a memorandum of understanding that completely reversed the market trading logic in the Strait of Hormuz.
Previously, the market had been concerned that a complete blockade of the Strait of Hormuz, a key shipping route for one-fifth of the world's crude oil, could trigger an energy crisis and uncontrolled geopolitical risks, supporting the continued premium of gold.
However, as the situation cooled down, the risk of waterway blockade was lifted, and shipping data showed that shipping capacity was slowly recovering, market panic quickly subsided.
The speculative funds that had flowed into gold due to geopolitical crises exited the market en masse, causing the gold-specific safe-haven premium to dissipate rapidly. This became the direct trigger for the rapid short-term decline in gold prices and the primary core factor behind the current simultaneous plunge in gold and silver prices.
In conventional trading logic, a decline in nominal yields and a rise in prices for US Treasury bonds typically benefits gold, a non-interest-bearing asset, and drives up gold prices.
However, this round of market activity has seen a rare divergence between the simultaneous weakening of bonds and gold. The core reason for this is that while nominal yields in the market have fallen, inflation expectations have declined even more significantly, meaning that the expectation gap for inflation is too large.
The current market pricing logic has shifted from "high inflation and relatively strong economic resilience" to expectations of "slower global economic growth, insufficient demand, and inflation gradually turning into deflation".
The most direct evidence is the sharp drop in international oil prices. Brent crude oil plummeted 3.8% in a single day, closing at $73.87 per barrel. As the core anchor of global inflation, the sharp decline in oil prices directly confirms the market's pessimistic expectations for weak global demand, continued decline in inflation, and even deflation in the future.
Against this backdrop, the market significantly lowered its long-term inflation expectations, while the 10-year US Treasury yield fell sharply to 4.41% at one point; however, the shift from inflation to deflation far exceeded the decline in nominal yields, ultimately driving real interest rates higher against the trend.
The real interest rate is the core anchor for pricing gold valuation. A rise in the real interest rate means that the opportunity cost of holding non-interest-bearing gold increases significantly. Even if the price of US Treasury bonds rises, gold is still under pressure and falls sharply, forming a rare asset divergence trend in the market.
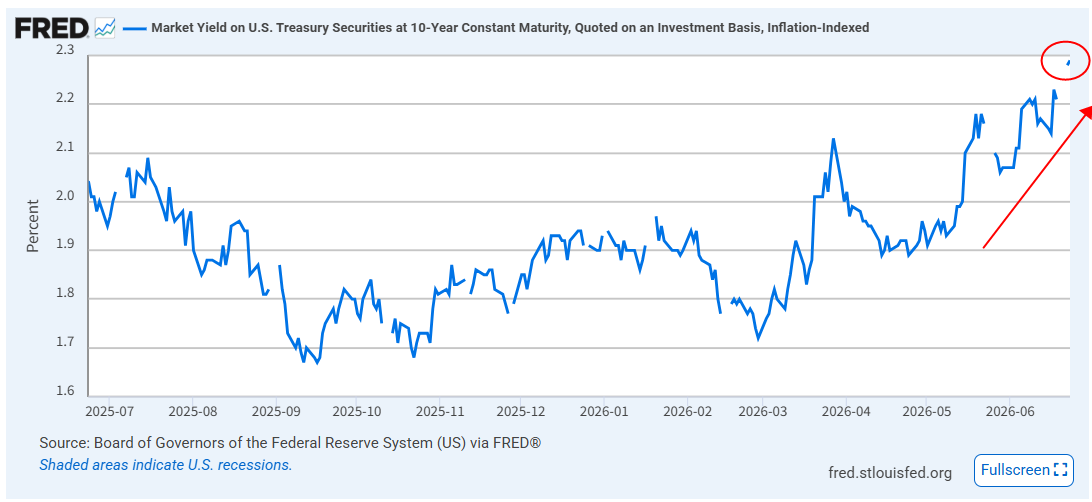
(The yields on U.S. inflation-hedging bonds, which reflect real interest rates, are surging. Source: Federal Reserve)
With geopolitical tensions receding and interest rate divergence as two core negative factors, the extreme shift in market investment style has further amplified the correction in gold prices.
Currently, capital market funds are completely biased towards high-growth sectors. AI technology growth stocks, with their high-growth and high-increase industry logic, continue to attract mainstream incremental funds from the market. Traditional assets are jokingly referred to as "old Deng assets," and as expected, they have collectively cooled down. This has led to the fact that old Deng assets as a whole are undeniably in a value range because they have fallen too much.
Meanwhile, traditional and outdated categories such as gold and traditional consumer goods, which lack growth elasticity and rely on safe-haven assets and valuation repair, have seen a continued decline in investor attention, experiencing a period of capital neglect and outflow.
The US stock market perfectly illustrates this style divergence: the S&P 500 fell slightly by 0.1%, the Nasdaq only dropped by 0.4%, the technology growth sector showed strong resilience, while traditional blue-chip stocks in the Dow Jones and precious metal-related assets continued to be weak.
The combination of factors, including the large amount of profit-taking accumulated during the previous years' bull market in gold, the concentrated realization of short-term negative factors, the concentrated profit-taking by market bulls, the continuous outflow of gold ETFs, and the significant reduction in non-commercial long positions in futures, has further deepened the current adjustment in gold prices.
Looking back at the Fed's policy tone, on June 17, the Fed kept the federal funds rate range unchanged at 3.50%-3.75%, but the post-meeting statement continued to monitor the risk of high inflation, releasing a clear hawkish signal of stabilizing prices.
The market thus priced in the policy expectation of "high interest rates lasting longer." The CME FedWatch Tool showed that the market was betting on an interest rate hike as early as September and a possible tightening of monetary policy in December, further increasing the cost of holding gold. Coupled with the aforementioned multiple negative factors, the gold price broke through the key support level of $4,000, triggering a concentrated spread of pessimism in the market.
Gold prices have fallen 25%-30% from their historical high of $5,600/ounce in January, dipping sharply to around $4,000, significantly shaking the confidence of short-term traders. However, from a long-term perspective, this deep correction is merely an intermediate adjustment in a bull market, not the end of the long-term trend.
Paul Williams, Managing Director of Solomon Global, used historical cycles to demonstrate that gold bull markets are never one-sided, and deep corrections are the norm: in the 1970s, gold retraced 45% in the middle before reaching a new historical high; in 2008, after a 30% retracement during the financial crisis, gold prices rebounded strongly and broke historical records again in 2011.
Even after this significant correction, gold's cumulative gain over the past 12 months is still close to 20%. The short-term decline in gold prices is driven only by short-term trading factors such as the fading of safe-haven premiums, fluctuations in interest rate expectations, shifts in investment styles, and profit-taking. The core fundamental logic supporting gold's long-term bullish trend has not fundamentally changed.
Finally, historical cycles can be replicated, and a strong recovery is inevitable after a deep adjustment.
Following the deep bear market in gold in 2015-2016, the precious metals sector and gold mining stocks simultaneously embarked on a major bull market. Currently, market sentiment is extremely pessimistic, speculative long positions have shrunk dramatically, and retail funds have completely withdrawn from the market, which highly overlaps with the characteristics of the bottom in those years. Therefore, the long-term investment strategy has a very advantageous risk-reward ratio.
Overall, the recent sharp drop in gold prices is the result of a confluence of three short-term negative factors: the fading of geopolitical safe-haven premium, a significant decline in inflation expectations leading to rising real interest rates, and a shift in market funding styles. It is a typical adjustment at the sentiment and trading level, rather than a collapse of fundamentals. However, this logic may still lead to further declines in gold prices.
However, short-term speculation is still possible. For example, if tonight's PCE figures exceed expectations, gold prices may fall further, and a rebound may occur after a bottoming pattern appears on the intraday chart.
Short-term factors such as the diversion of funds to AI technology stocks, the divergence between US Treasury bonds and gold prices, and the easing of geopolitical tensions will continue to disrupt the market. Gold prices may further decline to $3,600 per ounce.
However, from a long-term perspective, the value of gold will gradually become more apparent as the price of gold falls, supported by factors such as the central bank's rigid gold purchases, the return of valuations to low levels, the solid logic of macro hedging, and the historical recovery pattern.
For investors who abandon short-term speculation, adhere to long-term investment strategies spanning several years, and possess sufficient risk control capabilities, the current market correction phase, characterized by collective panic and concentrated capital flight, is opening a rare and excellent entry window. This round of correction, accompanied by the AI frenzy, is highly likely to become a key turning point for investment in the long-term bull market for gold.
From a technical perspective, gold prices have officially broken below the 0.618 level of 4050, and the next target price may test the 0.500 level around 3600. The current weak rebound may lead to further declines.
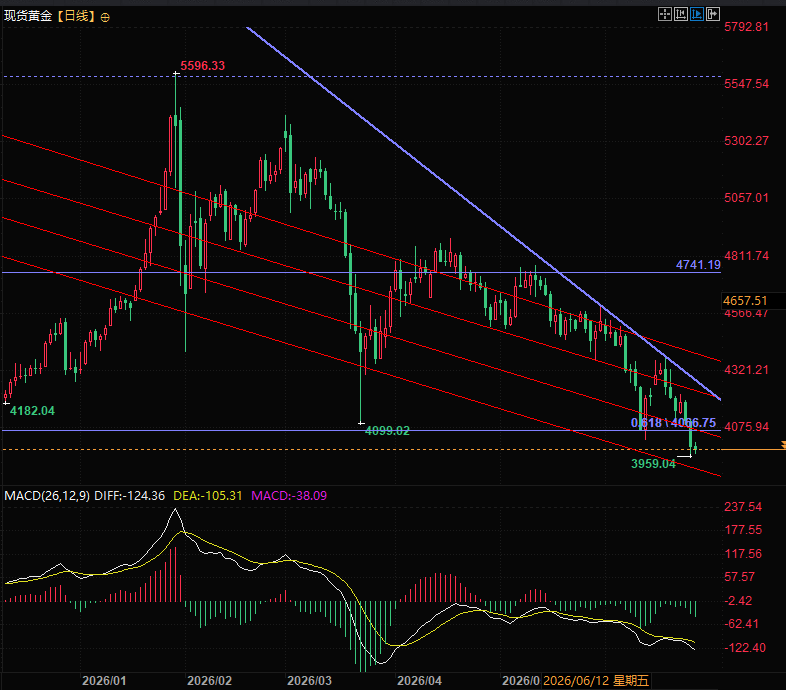
(Spot gold daily chart, source: FX678)
At 17:58 Beijing time, spot gold was trading at $3,988 per ounce.
The combined effects of a strong US dollar, a repricing of Federal Reserve interest rate expectations, and, in this article's most important factor, the global inflation expectation gap and a general decline in geopolitical risk aversion, completely offset the remaining safe-haven buying in the US-Iran geopolitical situation, causing precious metals to weaken accordingly.
This round of deep correction in gold prices is not due to a collapse in long-term fundamentals, but rather a structural adjustment triggered by the resonance of multiple short-term trading logics. Two core direct logics have dominated this round of gold price decline.
The first core logic: easing geopolitical conflicts and the complete disappearance of the safe-haven premium for gold.
Unlike conventional commodities, gold possesses strong safe-haven financial attributes. During periods of escalating geopolitical conflict and widespread market panic, funds will massively hoard gold to meet safe-haven demand. This creates an additional geopolitical safe-haven premium on top of the commodity and currency pricing, forcibly pushing up gold prices.
Although the day the US-Iran conflict broke out was basically the peak of gold prices, it is undeniable that risk aversion did provide a buying logic for gold and there was related buying pressure. However, the overall combined force ultimately led to a downward trend in gold prices.
The turning point in this round of market trends stemmed from the substantial easing of tensions between the US and Iran, with both sides reaching a memorandum of understanding that completely reversed the market trading logic in the Strait of Hormuz.
Previously, the market had been concerned that a complete blockade of the Strait of Hormuz, a key shipping route for one-fifth of the world's crude oil, could trigger an energy crisis and uncontrolled geopolitical risks, supporting the continued premium of gold.
However, as the situation cooled down, the risk of waterway blockade was lifted, and shipping data showed that shipping capacity was slowly recovering, market panic quickly subsided.
The speculative funds that had flowed into gold due to geopolitical crises exited the market en masse, causing the gold-specific safe-haven premium to dissipate rapidly. This became the direct trigger for the rapid short-term decline in gold prices and the primary core factor behind the current simultaneous plunge in gold and silver prices.
The second core logic: A significant divergence between yields and inflation expectations, with rising real interest rates suppressing gold prices.
In conventional trading logic, a decline in nominal yields and a rise in prices for US Treasury bonds typically benefits gold, a non-interest-bearing asset, and drives up gold prices.
However, this round of market activity has seen a rare divergence between the simultaneous weakening of bonds and gold. The core reason for this is that while nominal yields in the market have fallen, inflation expectations have declined even more significantly, meaning that the expectation gap for inflation is too large.
The current market pricing logic has shifted from "high inflation and relatively strong economic resilience" to expectations of "slower global economic growth, insufficient demand, and inflation gradually turning into deflation".
The most direct evidence is the sharp drop in international oil prices. Brent crude oil plummeted 3.8% in a single day, closing at $73.87 per barrel. As the core anchor of global inflation, the sharp decline in oil prices directly confirms the market's pessimistic expectations for weak global demand, continued decline in inflation, and even deflation in the future.
Against this backdrop, the market significantly lowered its long-term inflation expectations, while the 10-year US Treasury yield fell sharply to 4.41% at one point; however, the shift from inflation to deflation far exceeded the decline in nominal yields, ultimately driving real interest rates higher against the trend.
The real interest rate is the core anchor for pricing gold valuation. A rise in the real interest rate means that the opportunity cost of holding non-interest-bearing gold increases significantly. Even if the price of US Treasury bonds rises, gold is still under pressure and falls sharply, forming a rare asset divergence trend in the market.
(The yields on U.S. inflation-hedging bonds, which reflect real interest rates, are surging. Source: Federal Reserve)
The shift in investment style exacerbated the adjustment, leading to a collective diversion of funds from traditional assets.
With geopolitical tensions receding and interest rate divergence as two core negative factors, the extreme shift in market investment style has further amplified the correction in gold prices.
Currently, capital market funds are completely biased towards high-growth sectors. AI technology growth stocks, with their high-growth and high-increase industry logic, continue to attract mainstream incremental funds from the market. Traditional assets are jokingly referred to as "old Deng assets," and as expected, they have collectively cooled down. This has led to the fact that old Deng assets as a whole are undeniably in a value range because they have fallen too much.
Meanwhile, traditional and outdated categories such as gold and traditional consumer goods, which lack growth elasticity and rely on safe-haven assets and valuation repair, have seen a continued decline in investor attention, experiencing a period of capital neglect and outflow.
The US stock market perfectly illustrates this style divergence: the S&P 500 fell slightly by 0.1%, the Nasdaq only dropped by 0.4%, the technology growth sector showed strong resilience, while traditional blue-chip stocks in the Dow Jones and precious metal-related assets continued to be weak.
The combination of factors, including the large amount of profit-taking accumulated during the previous years' bull market in gold, the concentrated realization of short-term negative factors, the concentrated profit-taking by market bulls, the continuous outflow of gold ETFs, and the significant reduction in non-commercial long positions in futures, has further deepened the current adjustment in gold prices.
Looking back at the Fed's policy tone, on June 17, the Fed kept the federal funds rate range unchanged at 3.50%-3.75%, but the post-meeting statement continued to monitor the risk of high inflation, releasing a clear hawkish signal of stabilizing prices.
The market thus priced in the policy expectation of "high interest rates lasting longer." The CME FedWatch Tool showed that the market was betting on an interest rate hike as early as September and a possible tightening of monetary policy in December, further increasing the cost of holding gold. Coupled with the aforementioned multiple negative factors, the gold price broke through the key support level of $4,000, triggering a concentrated spread of pessimism in the market.
Cycle Review: Short-term Correction Does Not Change the Fundamentals of Gold's Long-Term Bull Market
Gold prices have fallen 25%-30% from their historical high of $5,600/ounce in January, dipping sharply to around $4,000, significantly shaking the confidence of short-term traders. However, from a long-term perspective, this deep correction is merely an intermediate adjustment in a bull market, not the end of the long-term trend.
Paul Williams, Managing Director of Solomon Global, used historical cycles to demonstrate that gold bull markets are never one-sided, and deep corrections are the norm: in the 1970s, gold retraced 45% in the middle before reaching a new historical high; in 2008, after a 30% retracement during the financial crisis, gold prices rebounded strongly and broke historical records again in 2011.
Even after this significant correction, gold's cumulative gain over the past 12 months is still close to 20%. The short-term decline in gold prices is driven only by short-term trading factors such as the fading of safe-haven premiums, fluctuations in interest rate expectations, shifts in investment styles, and profit-taking. The core fundamental logic supporting gold's long-term bullish trend has not fundamentally changed.
Finally, historical cycles can be replicated, and a strong recovery is inevitable after a deep adjustment.
Following the deep bear market in gold in 2015-2016, the precious metals sector and gold mining stocks simultaneously embarked on a major bull market. Currently, market sentiment is extremely pessimistic, speculative long positions have shrunk dramatically, and retail funds have completely withdrawn from the market, which highly overlaps with the characteristics of the bottom in those years. Therefore, the long-term investment strategy has a very advantageous risk-reward ratio.
Summary: Short-term selling may continue to be misjudged; patience is advised while waiting for long-term investment opportunities.
Overall, the recent sharp drop in gold prices is the result of a confluence of three short-term negative factors: the fading of geopolitical safe-haven premium, a significant decline in inflation expectations leading to rising real interest rates, and a shift in market funding styles. It is a typical adjustment at the sentiment and trading level, rather than a collapse of fundamentals. However, this logic may still lead to further declines in gold prices.
However, short-term speculation is still possible. For example, if tonight's PCE figures exceed expectations, gold prices may fall further, and a rebound may occur after a bottoming pattern appears on the intraday chart.
Short-term factors such as the diversion of funds to AI technology stocks, the divergence between US Treasury bonds and gold prices, and the easing of geopolitical tensions will continue to disrupt the market. Gold prices may further decline to $3,600 per ounce.
However, from a long-term perspective, the value of gold will gradually become more apparent as the price of gold falls, supported by factors such as the central bank's rigid gold purchases, the return of valuations to low levels, the solid logic of macro hedging, and the historical recovery pattern.
For investors who abandon short-term speculation, adhere to long-term investment strategies spanning several years, and possess sufficient risk control capabilities, the current market correction phase, characterized by collective panic and concentrated capital flight, is opening a rare and excellent entry window. This round of correction, accompanied by the AI frenzy, is highly likely to become a key turning point for investment in the long-term bull market for gold.
From a technical perspective, gold prices have officially broken below the 0.618 level of 4050, and the next target price may test the 0.500 level around 3600. The current weak rebound may lead to further declines.
(Spot gold daily chart, source: FX678)
At 17:58 Beijing time, spot gold was trading at $3,988 per ounce.
- Risk Warning and Disclaimer
- The market involves risk, and trading may not be suitable for all investors. This article is for reference only and does not constitute personal investment advice, nor does it take into account certain users’ specific investment objectives, financial situation, or other needs. Any investment decisions made based on this information are at your own risk.