Gold sprints toward $4,000, dollar retreats—why did volatility still surge despite PCE data not exceeding expectations?
2026-06-25 20:45:01
On Thursday (June 25) at 8:30 PM Beijing time, the U.S. Department of Commerce released the May Personal Consumption Expenditures (PCE) price index and the final reading of Q1 GDP. The PCE rose 4.1% year-on-year, in line with market expectations but the first time it has exceeded 4% since April 2023; core PCE rose to 3.4% year-on-year. Meanwhile, the final reading of Q1 GDP annualized quarterly rate was revised upward to 2.1%, higher than the previous second estimate of 1.6%. Prior to the data release, there was a clear divergence in market opinions regarding the Federal Reserve's policy path: some institutions worried about continued inflation driven by energy prices, with interest rate futures pricing indicating a high probability of a September rate hike; others believed that falling oil prices and economic resilience would alleviate the pressure.

Following the data release, the Stoxx Europe 600 index continued its upward trend, extending to 0.9%; US stock index futures maintained their gains; spot gold rose briefly before fluctuating around $4,000 per ounce; the US dollar index fell by about 10 points; and US Treasury yields generally declined slightly. Overall, the data did not trigger extreme volatility, but it reinforced market focus on the path of inflation.
The PCE data and the upward revision of GDP together outline the pattern of "resilient growth coupled with inflationary pressures" in the US economy. The 4.1% year-on-year PCE increase was mainly driven by energy prices, with gasoline and other components contributing significantly. Meanwhile, core PCE, excluding food and energy, increased by 3.4% year-on-year and 0.3% month-on-month, indicating that underlying price pressures are spreading moderately. Consumer spending jumped 0.7% month-on-month, accelerating from 0.4% in April, reflecting demand supported by tax refunds, the wealth effect from the stock market, and the depletion of savings. This echoes the upward revision of GDP to 2.1%—downward revisions to imports and consumption-related adjustments contributed to this revision.
Historically, a PCE exceeding 4% has been rare in the past three years, with the last similar level occurring in early 2023 when the Federal Reserve was in a rapid rate-hiking cycle. Currently, the federal funds rate is in the 3.50%-3.75% range. Last week, the Fed kept rates unchanged but its quarterly forecasts indicate a possible rate hike this year. While the latest data deviates only slightly from previous expectations, the breakthrough of the psychological threshold of 4% has amplified market pricing in policy tightening. Compared to the high-inflation period of 2022-2023, this round of inflation is more energy-driven, and there has been no significant weakening on the consumption side. This somewhat offsets the signal from the Chicago Fed National Activity Index falling to -0.10 in May: the negative contributions from production and employment categories indicate signs of a localized slowdown in economic momentum.
A clear contrast emerged between institutional and market participants' views before and after the data release. Prior to the data release, Wall Street's predictions for the Federal Reserve's actions were significantly divergent. Some asset management firms believed that falling oil prices would alleviate inflationary pressures, coupled with a potential weakening labor market in the second half of the year, suggesting the Fed might maintain interest rates or shift towards rate cuts. Laffer Tengler Investments and others emphasized that inflationary pressures primarily stemmed from energy, and that this might reverse in the future. Citigroup predicted a 25 basis point rate cut as early as October, while Bank of America Securities predicted three rate hikes this year. The flattening yield curve reflects market expectations that short-term interest rates will remain high.
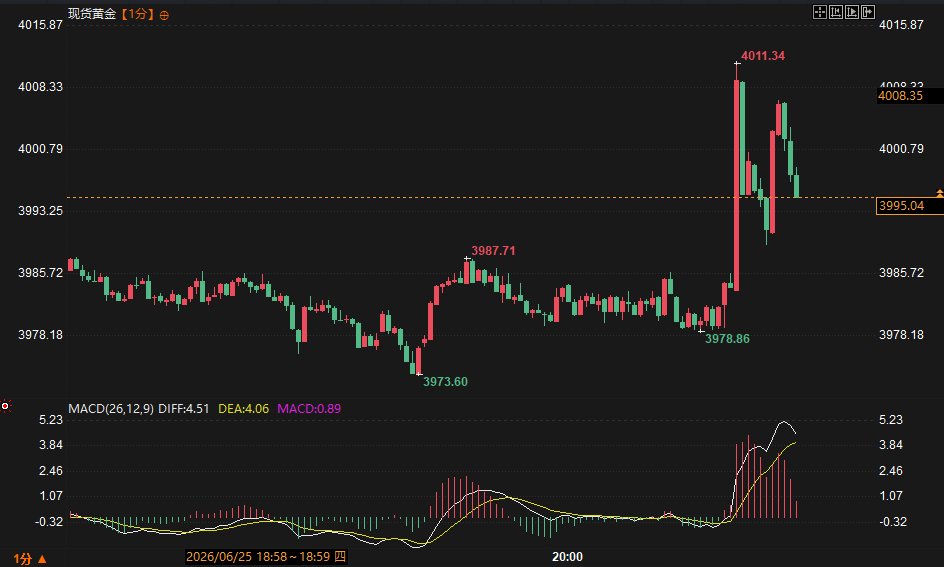
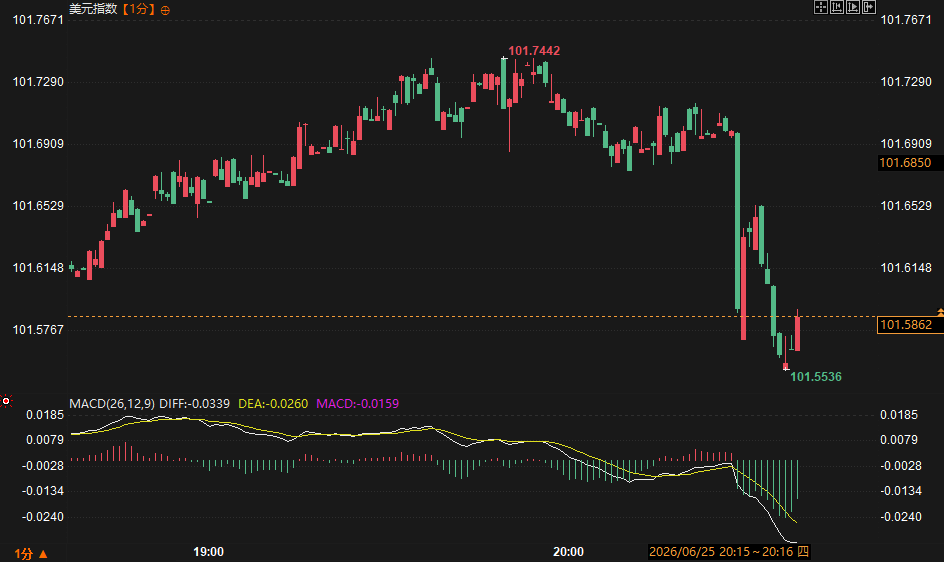
Following the data release, the financial markets reacted immediately, reflecting a rational digestion of the data: gold prices fluctuated after breaking through the $4,000 mark, reflecting the coexistence of risk aversion and inflation hedging demand; stock index futures continued their upward trend, benefiting from stronger-than-expected consumption data; the dollar index fell slightly, and US Treasury yields declined in the short term. At the retail level, there was considerable discussion about the risk of "stagflation" before the data release, but the focus shifted afterward to whether the resilience of consumption could sustain a soft landing for the economy. Well-known institutions paid more attention to the signals from the Fed's subsequent dot plot, emphasizing that the path of energy price declines would determine whether interest rate hikes would materialize. The overall discrepancy lies in the fact that pre-event pessimistic expectations regarding the persistence of inflation were slightly stronger than the actual data impact, and post-event, the market quickly shifted to assessing the differentiated impact of the "high growth-high inflation" combination on different assets.
From a technical perspective, related commodities are clearly driven by short-term data. The US dollar index found temporary support around 101.60, gold is showing signs of consolidation around the psychological level of $4,000, and US stock index futures maintain a bullish structure. In the long term, PCE and GDP data have not fundamentally changed the position of the economic cycle, but they have amplified the impact of policy uncertainty on volatility.
Considering both fundamentals and market reactions, future market movements will likely revolve around the pace of inflation decline, subsequent economic data releases, and communication with the Federal Reserve. In the short term, if energy prices continue to decline, core inflation pressures will ease, potentially reducing the market's over-pricing of a September rate hike and supporting risk assets. Conversely, if strong consumer spending continues to drive demand, the yield curve may remain flat, benefiting the relative performance of long-term bonds.
In the long term, the resilience of the US economy provides support for asset pricing, but inflation above target necessitates a cautious policy stance. Safe-haven assets such as gold may find temporary support amid uncertainty, while stock indices will depend on the continued performance of corporate profits and consumption. Extrapolating the overall trend requires continuous monitoring of subsequent CPI, employment, and statements from Federal Reserve officials; volatility is expected to remain high until the inflation path becomes clearer.
Q: Does the PCE data exceeding 4% mean that the Federal Reserve will inevitably raise interest rates in September?
The market has already partially priced in the interest rate hike expectations, but the data met expectations and key indicators showed a moderate month-on-month change. The Federal Reserve will make a comprehensive judgment based on subsequent data. Historical experience shows that a single month's energy-driven inflation increase does not necessarily trigger an immediate policy shift. It is necessary to observe whether the decline in energy prices is sustained and whether there are marginal changes in consumption.
Q: What impact will the upward revision of GDP to 2.1% have on the assessment of the economic cycle?
The upward revision mainly stemmed from adjustments to imports and consumption-related changes, indicating that the economy's resilience in the first quarter was stronger than initially anticipated. This aligns with the acceleration in consumer spending, suggesting that short-term growth momentum has not significantly weakened. However, the Chicago Fed Index turning negative indicates localized pressure, but overall, the economy remains in a range of slowing growth without recession.
Q: What is the logic behind the reaction of gold and the US dollar after the data is released?
The PCE figure met expectations but exceeded 4%, triggering a brief period of safe-haven demand and pushing gold prices higher. The dollar's short-term pullback reflects the market's overly optimistic interpretation of the data not exceeding expectations, as well as the support for growth expectations from strong consumption data. Both figures showed limited volatility, indicating rapid market pricing.
Q: Can strong consumer spending continue to support the economy?
The 0.7% month-on-month increase in May was driven by tax refunds, the wealth effect, and the depletion of savings. However, real income pressures remain in a high-inflation environment, and marginal changes in consumption in the third quarter need to be monitored. Historical data shows that consumption resilience is often more sustainable when policies and the employment environment are stable.
Q: What implications does this data have for global market linkages?
European stocks continued their upward trend, while US Treasury yields fell slightly, indicating a positive market interpretation of the "soft landing" signal from US data. Going forward, global asset pricing will continue to be influenced by the Federal Reserve's course, economic differences between the US and Europe, and geopolitical factors; cross-market volatility transmission needs to be monitored.
Following the data release, the Stoxx Europe 600 index continued its upward trend, extending to 0.9%; US stock index futures maintained their gains; spot gold rose briefly before fluctuating around $4,000 per ounce; the US dollar index fell by about 10 points; and US Treasury yields generally declined slightly. Overall, the data did not trigger extreme volatility, but it reinforced market focus on the path of inflation.
Deep interconnect analysis
The PCE data and the upward revision of GDP together outline the pattern of "resilient growth coupled with inflationary pressures" in the US economy. The 4.1% year-on-year PCE increase was mainly driven by energy prices, with gasoline and other components contributing significantly. Meanwhile, core PCE, excluding food and energy, increased by 3.4% year-on-year and 0.3% month-on-month, indicating that underlying price pressures are spreading moderately. Consumer spending jumped 0.7% month-on-month, accelerating from 0.4% in April, reflecting demand supported by tax refunds, the wealth effect from the stock market, and the depletion of savings. This echoes the upward revision of GDP to 2.1%—downward revisions to imports and consumption-related adjustments contributed to this revision.
Historically, a PCE exceeding 4% has been rare in the past three years, with the last similar level occurring in early 2023 when the Federal Reserve was in a rapid rate-hiking cycle. Currently, the federal funds rate is in the 3.50%-3.75% range. Last week, the Fed kept rates unchanged but its quarterly forecasts indicate a possible rate hike this year. While the latest data deviates only slightly from previous expectations, the breakthrough of the psychological threshold of 4% has amplified market pricing in policy tightening. Compared to the high-inflation period of 2022-2023, this round of inflation is more energy-driven, and there has been no significant weakening on the consumption side. This somewhat offsets the signal from the Chicago Fed National Activity Index falling to -0.10 in May: the negative contributions from production and employment categories indicate signs of a localized slowdown in economic momentum.
A clear contrast emerged between institutional and market participants' views before and after the data release. Prior to the data release, Wall Street's predictions for the Federal Reserve's actions were significantly divergent. Some asset management firms believed that falling oil prices would alleviate inflationary pressures, coupled with a potential weakening labor market in the second half of the year, suggesting the Fed might maintain interest rates or shift towards rate cuts. Laffer Tengler Investments and others emphasized that inflationary pressures primarily stemmed from energy, and that this might reverse in the future. Citigroup predicted a 25 basis point rate cut as early as October, while Bank of America Securities predicted three rate hikes this year. The flattening yield curve reflects market expectations that short-term interest rates will remain high.
Following the data release, the financial markets reacted immediately, reflecting a rational digestion of the data: gold prices fluctuated after breaking through the $4,000 mark, reflecting the coexistence of risk aversion and inflation hedging demand; stock index futures continued their upward trend, benefiting from stronger-than-expected consumption data; the dollar index fell slightly, and US Treasury yields declined in the short term. At the retail level, there was considerable discussion about the risk of "stagflation" before the data release, but the focus shifted afterward to whether the resilience of consumption could sustain a soft landing for the economy. Well-known institutions paid more attention to the signals from the Fed's subsequent dot plot, emphasizing that the path of energy price declines would determine whether interest rate hikes would materialize. The overall discrepancy lies in the fact that pre-event pessimistic expectations regarding the persistence of inflation were slightly stronger than the actual data impact, and post-event, the market quickly shifted to assessing the differentiated impact of the "high growth-high inflation" combination on different assets.
From a technical perspective, related commodities are clearly driven by short-term data. The US dollar index found temporary support around 101.60, gold is showing signs of consolidation around the psychological level of $4,000, and US stock index futures maintain a bullish structure. In the long term, PCE and GDP data have not fundamentally changed the position of the economic cycle, but they have amplified the impact of policy uncertainty on volatility.
Trend Outlook
Considering both fundamentals and market reactions, future market movements will likely revolve around the pace of inflation decline, subsequent economic data releases, and communication with the Federal Reserve. In the short term, if energy prices continue to decline, core inflation pressures will ease, potentially reducing the market's over-pricing of a September rate hike and supporting risk assets. Conversely, if strong consumer spending continues to drive demand, the yield curve may remain flat, benefiting the relative performance of long-term bonds.
In the long term, the resilience of the US economy provides support for asset pricing, but inflation above target necessitates a cautious policy stance. Safe-haven assets such as gold may find temporary support amid uncertainty, while stock indices will depend on the continued performance of corporate profits and consumption. Extrapolating the overall trend requires continuous monitoring of subsequent CPI, employment, and statements from Federal Reserve officials; volatility is expected to remain high until the inflation path becomes clearer.
Frequently Asked Questions
Q: Does the PCE data exceeding 4% mean that the Federal Reserve will inevitably raise interest rates in September?
The market has already partially priced in the interest rate hike expectations, but the data met expectations and key indicators showed a moderate month-on-month change. The Federal Reserve will make a comprehensive judgment based on subsequent data. Historical experience shows that a single month's energy-driven inflation increase does not necessarily trigger an immediate policy shift. It is necessary to observe whether the decline in energy prices is sustained and whether there are marginal changes in consumption.
Q: What impact will the upward revision of GDP to 2.1% have on the assessment of the economic cycle?
The upward revision mainly stemmed from adjustments to imports and consumption-related changes, indicating that the economy's resilience in the first quarter was stronger than initially anticipated. This aligns with the acceleration in consumer spending, suggesting that short-term growth momentum has not significantly weakened. However, the Chicago Fed Index turning negative indicates localized pressure, but overall, the economy remains in a range of slowing growth without recession.
Q: What is the logic behind the reaction of gold and the US dollar after the data is released?
The PCE figure met expectations but exceeded 4%, triggering a brief period of safe-haven demand and pushing gold prices higher. The dollar's short-term pullback reflects the market's overly optimistic interpretation of the data not exceeding expectations, as well as the support for growth expectations from strong consumption data. Both figures showed limited volatility, indicating rapid market pricing.
Q: Can strong consumer spending continue to support the economy?
The 0.7% month-on-month increase in May was driven by tax refunds, the wealth effect, and the depletion of savings. However, real income pressures remain in a high-inflation environment, and marginal changes in consumption in the third quarter need to be monitored. Historical data shows that consumption resilience is often more sustainable when policies and the employment environment are stable.
Q: What implications does this data have for global market linkages?
European stocks continued their upward trend, while US Treasury yields fell slightly, indicating a positive market interpretation of the "soft landing" signal from US data. Going forward, global asset pricing will continue to be influenced by the Federal Reserve's course, economic differences between the US and Europe, and geopolitical factors; cross-market volatility transmission needs to be monitored.
- Risk Warning and Disclaimer
- The market involves risk, and trading may not be suitable for all investors. This article is for reference only and does not constitute personal investment advice, nor does it take into account certain users’ specific investment objectives, financial situation, or other needs. Any investment decisions made based on this information are at your own risk.