With the non-farm payrolls data still uncertain, is the gold price rebound a "false alarm" or a "prelude"?
2026-06-29 16:29:22
On Monday (June 29), spot gold maintained a fluctuating trend during the European session, currently trading around $4,060 per ounce.
Gold prices rebounded slightly after falling below the psychological level of $4,000, but the rebound was weak and lacked confidence, reflecting more of a wait-and-see attitude from the market ahead of key data releases than a trend reversal signal. The June non-farm payroll report this Thursday (released earlier due to a US holiday) may reignite the debate at the Federal Reserve regarding the number of interest rate hikes, thus determining whether gold will stabilize in the short term or continue its downward trend.

June's non-farm payrolls report is far more than just a routine employment data update. Since new Federal Reserve Chairman Kevin Warsh unexpectedly released hawkish signals at the June meeting, the market has largely priced in the expectation of another rate hike this year. However, the real suspense lies in whether one rate hike will be enough. Thursday's employment data will either solidify this expectation or reignite discussions about two rate hikes—which would mean drastically different prospects for the dollar and gold.
This report contains a significant distraction: the FIFA World Cup spurred a temporary hiring boom in sectors such as hotels, transportation, and event management, with some estimates suggesting this could artificially inflate employment by approximately 40,000. This makes this non-farm payroll report the kind where "the headline may not reflect the whole picture"—if strong data is primarily driven by temporary hiring, policymakers may not interpret it as a sign of renewed acceleration in labor demand. Investors will be paying closer attention to wages, the unemployment rate, and broader labor market indicators to determine whether the Federal Reserve needs more aggressive tightening.
The market generally expects June's non-farm payrolls to slow to between 115,000 and 130,000 from 172,000, with the unemployment rate remaining flat at 4.3% or rising slightly to 4.4%. Average hourly earnings are expected to rise 0.3% month-on-month, with the year-on-year growth rate falling from 3.5% to 3.4%. Overall, this forecast paints a picture of a moderate cooling in the labor market, consistent with the Federal Reserve's narrative of gradually easing policy constraints.
However, there is a significant "noise" in this data – the FIFA World Cup created a large number of temporary jobs in sectors such as hotels, transportation, and event management. Some institutions estimate that this factor may have artificially inflated the employment figure by approximately 40,000. This means that even if the final number of new jobs reaches or exceeds the upper limit of expectations, a considerable portion of it may lack sustainability and be a typical "one-off pulse" rather than a trend of improvement.
Therefore, the market needs to look beyond the overall figures and focus on the intrinsic quality of the data in interpreting this week's non-farm payrolls report. Investors should pay close attention to the specific contributions of the leisure and hospitality industry, the structural differences between private sector and government employment, the "quality" of wage growth, and the correlation between labor force participation rate and unemployment rate. Only by eliminating the temporary disturbances brought about by the World Cup can we accurately judge the true nature of the US labor market and whether this report will solidify or shake the market's pricing of the number of Fed rate hikes this year.
Scenario 1: The data matches expectations (high probability)
The market will likely continue to price in a single rate hike, with September being the most probable window and December as an alternative. This outcome is unlikely to trigger a new surge in the dollar, but it should be enough to prevent a significant pullback. For gold, this likely means short-term stabilization rather than a genuine rebound—especially given the uncertainty surrounding the June CPI data two weeks from now.
Scenario 2: Data significantly exceeds expectations, especially with wages rising in tandem (most bearish for gold).
This would strengthen the case for a September rate hike and reignite speculation of another rate hike in December, further reinforcing the medium-term upward trend of the US dollar. Gold will face a severe test at the $4,000 level, and may even open up new downside potential.
Scenario 3: Data unexpectedly falls short of expectations (low probability)
Considering the temporary boost from the World Cup, the possibility of weaker-than-expected data is relatively small. However, even if it does occur, a single month's weak data is unlikely to fundamentally change the Federal Reserve's tightening stance after several months of resilient employment. A more likely reaction is that the market will postpone its rate hike expectations from September to December, rather than completely ruling out further tightening. In this scenario, gold may establish a temporary bottom in the $4000-$4400 range, but it is unlikely to trigger a new bull market.
According to the daily chart, spot gold is currently in a medium-term downtrend, with prices falling continuously from a high of 5419.01, and recently rebounding slightly after testing a low of 3959.04. The short-term 20-day moving average (MA20) (4227.20), the medium-term 50-day moving average (MA50) (4453.28), and the long-term 100-day and 200-day moving averages are all above the price, forming layers of resistance. The primary resistance for any rebound is near the 20-day moving average, and the resistance from these medium- and long-term moving averages suggests that the downtrend has not fundamentally reversed.
In terms of indicators, the MACD remains in negative territory, with the DIFF (-118.89) continuing to be below the DEA (-109.97), and the green bars continuing. Although the bearish momentum has slightly subsided, there is no clear golden cross reversal signal. The RSI value is 36.11, which is in the weak zone below the 50 midline. Although it has not entered oversold territory, the bullish buying power is weak, and there is no signal of stabilization and strengthening yet.
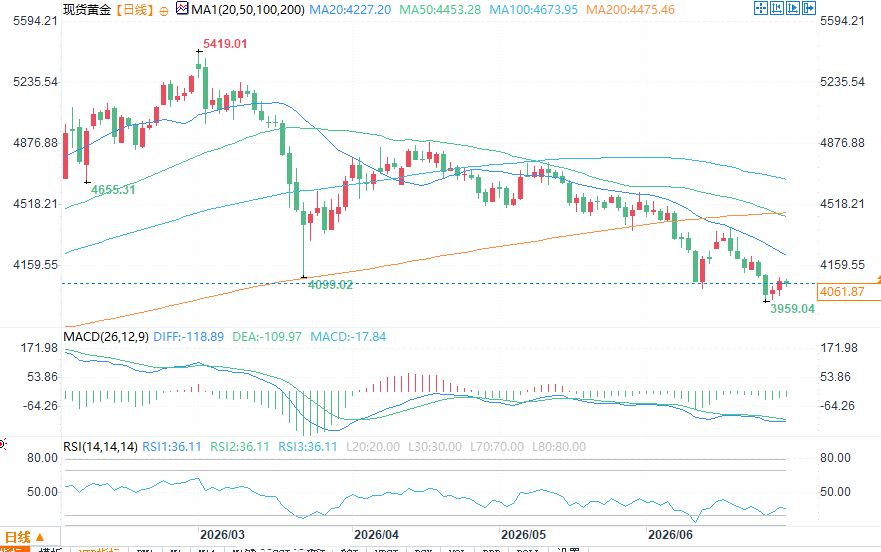
(Spot gold daily chart, source: FX678)
At 16:02 Beijing time on June 29, spot gold was trading at $4063.11 per ounce.
Gold prices rebounded slightly after falling below the psychological level of $4,000, but the rebound was weak and lacked confidence, reflecting more of a wait-and-see attitude from the market ahead of key data releases than a trend reversal signal. The June non-farm payroll report this Thursday (released earlier due to a US holiday) may reignite the debate at the Federal Reserve regarding the number of interest rate hikes, thus determining whether gold will stabilize in the short term or continue its downward trend.
Non-farm payrolls background: An unusual jobs report
June's non-farm payrolls report is far more than just a routine employment data update. Since new Federal Reserve Chairman Kevin Warsh unexpectedly released hawkish signals at the June meeting, the market has largely priced in the expectation of another rate hike this year. However, the real suspense lies in whether one rate hike will be enough. Thursday's employment data will either solidify this expectation or reignite discussions about two rate hikes—which would mean drastically different prospects for the dollar and gold.
This report contains a significant distraction: the FIFA World Cup spurred a temporary hiring boom in sectors such as hotels, transportation, and event management, with some estimates suggesting this could artificially inflate employment by approximately 40,000. This makes this non-farm payroll report the kind where "the headline may not reflect the whole picture"—if strong data is primarily driven by temporary hiring, policymakers may not interpret it as a sign of renewed acceleration in labor demand. Investors will be paying closer attention to wages, the unemployment rate, and broader labor market indicators to determine whether the Federal Reserve needs more aggressive tightening.
Data Forecast: Slower Growth But Implicit Structural Disturbances
The market generally expects June's non-farm payrolls to slow to between 115,000 and 130,000 from 172,000, with the unemployment rate remaining flat at 4.3% or rising slightly to 4.4%. Average hourly earnings are expected to rise 0.3% month-on-month, with the year-on-year growth rate falling from 3.5% to 3.4%. Overall, this forecast paints a picture of a moderate cooling in the labor market, consistent with the Federal Reserve's narrative of gradually easing policy constraints.
However, there is a significant "noise" in this data – the FIFA World Cup created a large number of temporary jobs in sectors such as hotels, transportation, and event management. Some institutions estimate that this factor may have artificially inflated the employment figure by approximately 40,000. This means that even if the final number of new jobs reaches or exceeds the upper limit of expectations, a considerable portion of it may lack sustainability and be a typical "one-off pulse" rather than a trend of improvement.
Therefore, the market needs to look beyond the overall figures and focus on the intrinsic quality of the data in interpreting this week's non-farm payrolls report. Investors should pay close attention to the specific contributions of the leisure and hospitality industry, the structural differences between private sector and government employment, the "quality" of wage growth, and the correlation between labor force participation rate and unemployment rate. Only by eliminating the temporary disturbances brought about by the World Cup can we accurately judge the true nature of the US labor market and whether this report will solidify or shake the market's pricing of the number of Fed rate hikes this year.
Three Scenarios: Three Fates of Gold
Scenario 1: The data matches expectations (high probability)
The market will likely continue to price in a single rate hike, with September being the most probable window and December as an alternative. This outcome is unlikely to trigger a new surge in the dollar, but it should be enough to prevent a significant pullback. For gold, this likely means short-term stabilization rather than a genuine rebound—especially given the uncertainty surrounding the June CPI data two weeks from now.
Scenario 2: Data significantly exceeds expectations, especially with wages rising in tandem (most bearish for gold).
This would strengthen the case for a September rate hike and reignite speculation of another rate hike in December, further reinforcing the medium-term upward trend of the US dollar. Gold will face a severe test at the $4,000 level, and may even open up new downside potential.
Scenario 3: Data unexpectedly falls short of expectations (low probability)
Considering the temporary boost from the World Cup, the possibility of weaker-than-expected data is relatively small. However, even if it does occur, a single month's weak data is unlikely to fundamentally change the Federal Reserve's tightening stance after several months of resilient employment. A more likely reaction is that the market will postpone its rate hike expectations from September to December, rather than completely ruling out further tightening. In this scenario, gold may establish a temporary bottom in the $4000-$4400 range, but it is unlikely to trigger a new bull market.
Technical Analysis
According to the daily chart, spot gold is currently in a medium-term downtrend, with prices falling continuously from a high of 5419.01, and recently rebounding slightly after testing a low of 3959.04. The short-term 20-day moving average (MA20) (4227.20), the medium-term 50-day moving average (MA50) (4453.28), and the long-term 100-day and 200-day moving averages are all above the price, forming layers of resistance. The primary resistance for any rebound is near the 20-day moving average, and the resistance from these medium- and long-term moving averages suggests that the downtrend has not fundamentally reversed.
In terms of indicators, the MACD remains in negative territory, with the DIFF (-118.89) continuing to be below the DEA (-109.97), and the green bars continuing. Although the bearish momentum has slightly subsided, there is no clear golden cross reversal signal. The RSI value is 36.11, which is in the weak zone below the 50 midline. Although it has not entered oversold territory, the bullish buying power is weak, and there is no signal of stabilization and strengthening yet.
(Spot gold daily chart, source: FX678)
At 16:02 Beijing time on June 29, spot gold was trading at $4063.11 per ounce.
- Risk Warning and Disclaimer
- The market involves risk, and trading may not be suitable for all investors. This article is for reference only and does not constitute personal investment advice, nor does it take into account certain users’ specific investment objectives, financial situation, or other needs. Any investment decisions made based on this information are at your own risk.