The yen has fallen back to 1986 levels! The 162 mark has been breached. Who will win the game between non-farm payrolls and intervention?
2026-06-30 20:06:14
On Monday (June 30), the US dollar continued its strength against the Japanese yen, reaching its highest level in nearly 40 years. The latest quote was steady around 162.38, up about 0.2% on the day. Japanese Finance Minister Satsuki Katayama reiterated that Japan is "ready to respond appropriately," but the wording did not escalate to a stronger warning of intervention. The market is testing the limits of the Japanese authorities' patience.
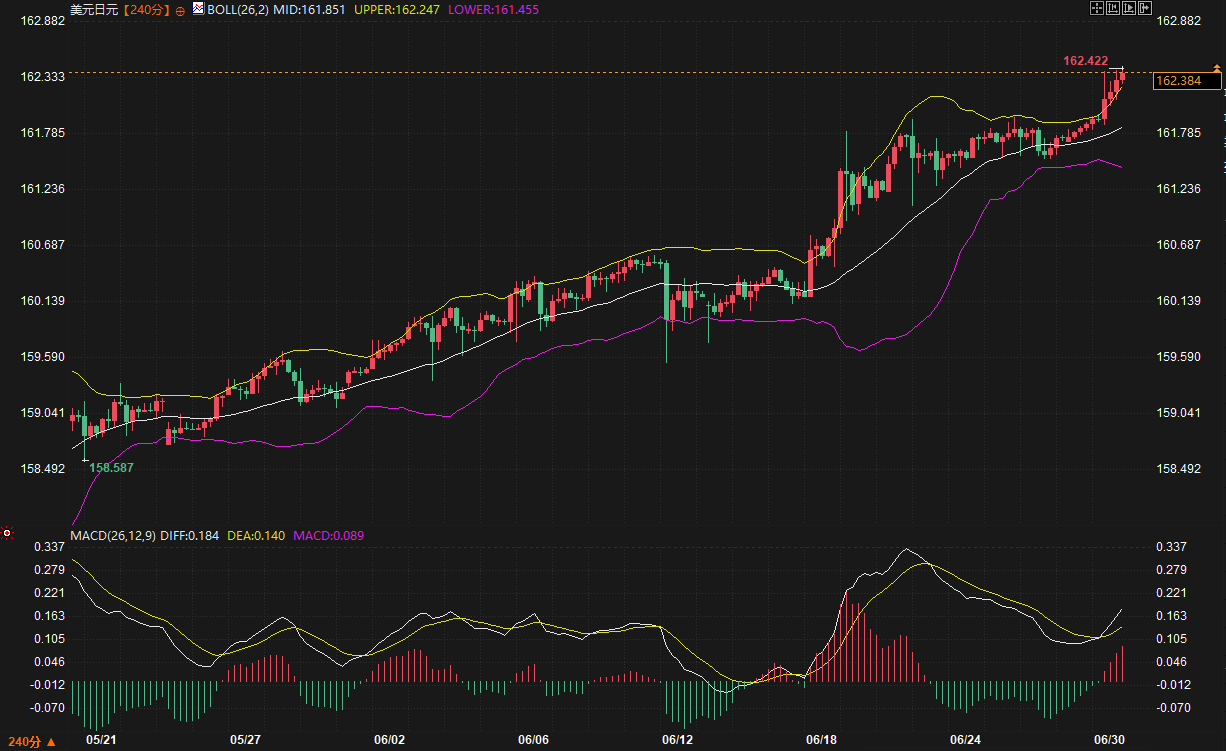
From a technical perspective, USD/JPY has risen approximately 3.8% since May 21st, currently trading close to the upper Bollinger Band, indicating a clear bullish trend. However, after breaking through the upper Bollinger Band at 162.25, overbought signals have emerged, and short-term technical correction pressure cannot be ignored. More importantly, this yen depreciation is almost entirely reflected in its weakness against the dollar – the euro/yen pair is trading at 184.97, still about 1.5% lower than the historical high of 187.95 reached in April. This means that the yen's weakness lies with the dollar, rather than a complete collapse.
The driving logic behind this round of yen weakness stems from a clear macroeconomic narrative: the significant interest rate differential between Japanese and US Treasury yields continues to provide fertile ground for carry trades. Even though the Bank of Japan has already raised interest rates, its interest rate level remains vastly different from that of the United States. Investors borrowing low-interest yen and investing in high-yield dollar assets has become a structural force suppressing the yen.
Meanwhile, Japanese authorities are facing a dilemma. From April to May this year, the Ministry of Finance intervened in the foreign exchange market with 11.7 trillion yen, briefly suppressing the upward momentum of the dollar against the yen. However, just over a month later, the exchange rate had completely recovered its losses and reached a new high. The prevailing market view is that the previous intervention failed to reverse the trend, which may have made Japan more hesitant. Some analysts point out that, unlike in April, this time the yen has only weakened against the dollar, not depreciated across the board, which also reduces the urgency for coordinated action by the authorities.
Technically, the 240-minute chart also corroborates this predicament. The Bollinger Bands are generally opening upwards , with the middle band at 161.85 and the lower band at 161.45, forming a short-term support area. In the MACD indicator, both the fast line DIFF and the slow line DEA are maintaining a golden cross divergence above the zero axis, and the red bars remain positive, confirming that the bullish momentum has not dissipated. However, it should be noted that the price has been trading outside the upper band for several consecutive candlesticks. If the MACD red bars show signs of shortening, it will be an early warning sign of weakening upward momentum.
This week, the US will release a series of employment data, including non-farm payrolls, which will be a key variable in assessing the strength of the US dollar. The prevailing market view is that recent expectations of a Fed rate hike have supported the dollar, but if US data shows signs of weakness, the dollar may give back some of its gains. However, at the current juncture, there is a lack of a catalyst to directly trigger this reversal.
The following are key intraday reference ranges to watch: Current resistance is at 162.42 (today's high). If this level is broken, there is a lack of clear historical references above. Support is initially seen at 161.85 (Bollinger Middle Band), which is a short-term support/resistance level. If this level is breached, the next target is around 161.45 (Bollinger Lower Band). For EUR/JPY, 184.00 is the recent support level, while resistance remains at the historical high of 187.95.
Why has the yen continued to weaken after the Bank of Japan raised interest rates?
Although the Bank of Japan has raised interest rates, the absolute level of interest rates remains far lower than that of the United States. The significant interest rate differential between the two countries keeps carry trade active, and investors borrowing yen to invest in dollars are exerting structural downward pressure. The rate hikes are insufficient to close this gap.
Why has the Ministry of Finance been so slow to intervene?
The effects of the 11.7 trillion yen intervention in April and May have faded and failed to reverse the trend. This time, the yen only weakened against the dollar, rather than depreciating across the board, reducing the necessity and coordination of intervention. Furthermore, the lack of cooperation from the United States also weakened the deterrent effect of the unilateral intervention.
What does breaking through the upper Bollinger Band mean?
A price breakout above the upper Bollinger Band typically indicates a strong bullish trend, but also signals overbought conditions . A short-term pullback is possible, but the upward-opening Bollinger Bands confirm the bullish trend. If the pullback doesn't break the middle band, the trend structure remains healthy.
What events this week could trigger a shift in the yen's direction?
US employment data is a key variable. If non-farm payroll data is weaker than expected, the market may reassess the probability of a Fed rate hike, thereby weakening the dollar and indirectly boosting the yen. At the same time, continued attention should be paid to whether the Japanese Ministry of Finance escalates its verbal intervention rhetoric.
Why did the euro not reach a new high against the yen?
The current weakness of the yen is largely concentrated on the dollar. The euro/yen exchange rate is currently about 1.5% away from its April record high, reflecting some support for the euro from expectations of a European Central Bank rate hike, while market concerns about the eurozone's economic outlook are limiting the euro's gains.
From a technical perspective, USD/JPY has risen approximately 3.8% since May 21st, currently trading close to the upper Bollinger Band, indicating a clear bullish trend. However, after breaking through the upper Bollinger Band at 162.25, overbought signals have emerged, and short-term technical correction pressure cannot be ignored. More importantly, this yen depreciation is almost entirely reflected in its weakness against the dollar – the euro/yen pair is trading at 184.97, still about 1.5% lower than the historical high of 187.95 reached in April. This means that the yen's weakness lies with the dollar, rather than a complete collapse.
Japanese bond yield spreads and the intervention dilemma form the main fundamental theme.
The driving logic behind this round of yen weakness stems from a clear macroeconomic narrative: the significant interest rate differential between Japanese and US Treasury yields continues to provide fertile ground for carry trades. Even though the Bank of Japan has already raised interest rates, its interest rate level remains vastly different from that of the United States. Investors borrowing low-interest yen and investing in high-yield dollar assets has become a structural force suppressing the yen.
Meanwhile, Japanese authorities are facing a dilemma. From April to May this year, the Ministry of Finance intervened in the foreign exchange market with 11.7 trillion yen, briefly suppressing the upward momentum of the dollar against the yen. However, just over a month later, the exchange rate had completely recovered its losses and reached a new high. The prevailing market view is that the previous intervention failed to reverse the trend, which may have made Japan more hesitant. Some analysts point out that, unlike in April, this time the yen has only weakened against the dollar, not depreciated across the board, which also reduces the urgency for coordinated action by the authorities.
Technically, the 240-minute chart also corroborates this predicament. The Bollinger Bands are generally opening upwards , with the middle band at 161.85 and the lower band at 161.45, forming a short-term support area. In the MACD indicator, both the fast line DIFF and the slow line DEA are maintaining a golden cross divergence above the zero axis, and the red bars remain positive, confirming that the bullish momentum has not dissipated. However, it should be noted that the price has been trading outside the upper band for several consecutive candlesticks. If the MACD red bars show signs of shortening, it will be an early warning sign of weakening upward momentum.
The market enters a sensitive window ahead of the non-farm payroll data release.
This week, the US will release a series of employment data, including non-farm payrolls, which will be a key variable in assessing the strength of the US dollar. The prevailing market view is that recent expectations of a Fed rate hike have supported the dollar, but if US data shows signs of weakness, the dollar may give back some of its gains. However, at the current juncture, there is a lack of a catalyst to directly trigger this reversal.
The following are key intraday reference ranges to watch: Current resistance is at 162.42 (today's high). If this level is broken, there is a lack of clear historical references above. Support is initially seen at 161.85 (Bollinger Middle Band), which is a short-term support/resistance level. If this level is breached, the next target is around 161.45 (Bollinger Lower Band). For EUR/JPY, 184.00 is the recent support level, while resistance remains at the historical high of 187.95.
Frequently Asked Questions
Why has the yen continued to weaken after the Bank of Japan raised interest rates?
Although the Bank of Japan has raised interest rates, the absolute level of interest rates remains far lower than that of the United States. The significant interest rate differential between the two countries keeps carry trade active, and investors borrowing yen to invest in dollars are exerting structural downward pressure. The rate hikes are insufficient to close this gap.
Why has the Ministry of Finance been so slow to intervene?
The effects of the 11.7 trillion yen intervention in April and May have faded and failed to reverse the trend. This time, the yen only weakened against the dollar, rather than depreciating across the board, reducing the necessity and coordination of intervention. Furthermore, the lack of cooperation from the United States also weakened the deterrent effect of the unilateral intervention.
What does breaking through the upper Bollinger Band mean?
A price breakout above the upper Bollinger Band typically indicates a strong bullish trend, but also signals overbought conditions . A short-term pullback is possible, but the upward-opening Bollinger Bands confirm the bullish trend. If the pullback doesn't break the middle band, the trend structure remains healthy.
What events this week could trigger a shift in the yen's direction?
US employment data is a key variable. If non-farm payroll data is weaker than expected, the market may reassess the probability of a Fed rate hike, thereby weakening the dollar and indirectly boosting the yen. At the same time, continued attention should be paid to whether the Japanese Ministry of Finance escalates its verbal intervention rhetoric.
Why did the euro not reach a new high against the yen?
The current weakness of the yen is largely concentrated on the dollar. The euro/yen exchange rate is currently about 1.5% away from its April record high, reflecting some support for the euro from expectations of a European Central Bank rate hike, while market concerns about the eurozone's economic outlook are limiting the euro's gains.
- Risk Warning and Disclaimer
- The market involves risk, and trading may not be suitable for all investors. This article is for reference only and does not constitute personal investment advice, nor does it take into account certain users’ specific investment objectives, financial situation, or other needs. Any investment decisions made based on this information are at your own risk.