Gold prices stabilized after hitting a seven-month low, pressured by expectations of a Federal Reserve rate hike.
2026-07-01 02:06:42
On Tuesday (June 30), spot gold fell to $3,943.65 during the Asian session, hitting a seven-month low, before rebounding as bargain hunters helped the precious metal recover some of its losses. Spot gold traded around $4,030.39 during the session, having touched a high of $4,063 at one point.
Despite a slight rebound in gold prices that day, the current quarter is still projected to be the worst quarterly performance for gold since 2013, erasing all gains made this year. Gold prices fell nearly 18% this quarter, with a monthly drop of approximately 11%, potentially marking the largest monthly decline since 2008.

The trigger for this decline in gold prices was the energy inflation shock caused by geopolitical conflicts in the Middle East, which led the market to reprice itself, raise its expectations for Federal Reserve rate hikes, and shift its overall stance towards hawkishness.
Logically, geopolitical tensions and rising inflation should benefit gold. However, higher interest rates will diminish gold's appeal—gold itself does not generate interest income, making it less competitive compared to interest-bearing assets.
Meanwhile, the uncertainty surrounding whether the US and Iran will begin a new round of negotiations in Qatar, coupled with market expectations that the Federal Reserve will raise lending rates in the second half of this year, has provided support for the US dollar.
The US Dollar Index (DXY), which measures the dollar's performance against a basket of six major currencies, is currently trading around 101.10 and is poised for its second consecutive monthly gain. A stronger dollar increases the cost of gold for overseas buyers, further pressuring gold prices.
Data from the CME FedWatch Tool shows that traders currently expect a 63% probability of a rate hike at the Federal Reserve's September meeting. Cleveland Federal Reserve Bank President Beth Hammark stated on Tuesday, "To bring inflation back to our target level, we may have to raise interest rates further," while also acknowledging, "I am concerned that a rate hike could have a negative impact on the rest of the economy."
The market will be closely watching this week's U.S. labor market data for clues about the Federal Reserve's future policy moves. The Job Openings and Labor Turnover Survey (JOLTS) released on Tuesday showed that U.S. job openings rose to 7.594 million in May, higher than the market expectation of 7.3 million.
The market's attention will now focus on the ADP private sector employment data to be released on Wednesday, followed by the non-farm payrolls (NFP) data on Thursday. Due to the July 4th Independence Day holiday, this year's NFP release is one day earlier than usual.
A series of upcoming employment data releases may determine the short-term direction of gold. The $4,000 level is a key psychological support level; as long as this level is not effectively broken, spot gold will likely remain range-bound near its recent lows.
Societe Generale strategists stated, "Although the current decline in gold prices has been overextended, there are currently no clear signs of a significant rebound. Even if gold prices experience a short-term rebound, the previous turning point high of $4,100 will be the first resistance level. Once gold prices fall below $3,885, the subsequent downside target will be $3,750, with the next target at $3,600."
Technical Analysis: The downtrend remains firm below key moving averages.
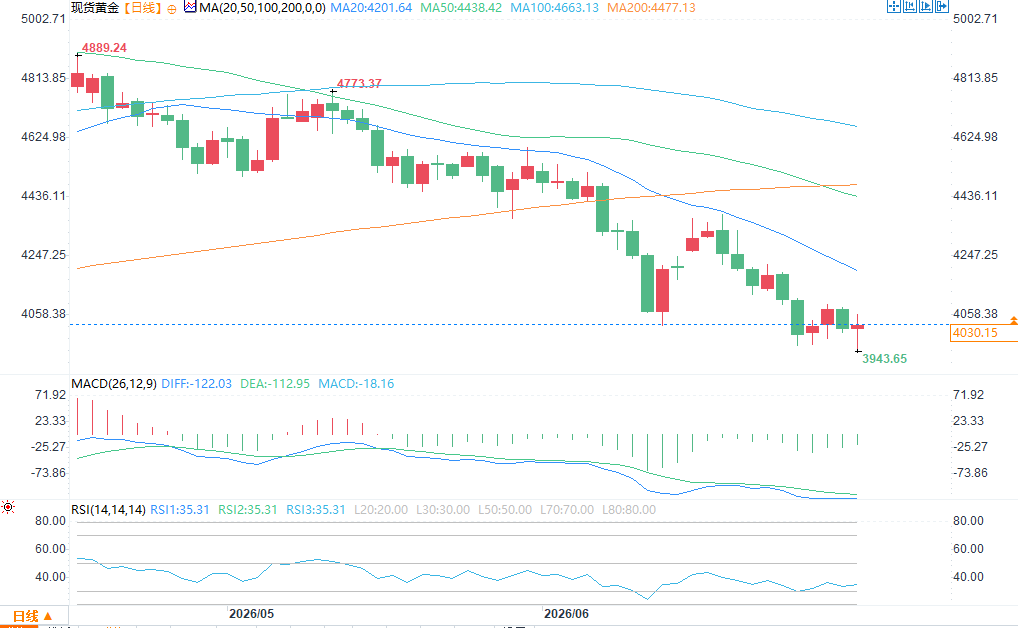
(Spot gold daily chart source: FX678)
On the daily chart, the short-term downtrend for spot gold remains unchanged, with the price trading significantly below the 50-day, 100-day, and 200-day simple moving averages (SMAs). These moving averages are MA50: $4438.42, MA100: $4663.13, and MA200: $4477.13, respectively, and are concentrated in the $4438.42-$4663.13 range.
Gold is currently attempting to stabilize above the $4,000 level. The Relative Strength Index (RSI) is at 35.33, still in the weak zone; the Directional Movement Index (ADX) is at 42, indicating that the current downward trend remains strong. This means that downward pressure is likely to continue until gold prices regain their footing above the key resistance level.
MACD indicator: DIFF=-122.02, DEA=-112.95, MACD histogram=-18.13, the bearish momentum has not yet completely exhausted.
On the downside, the first support level is the $4,000 support zone (current price $4,030.39). If this level is broken, gold prices will likely begin a new round of declines, with a potential low of $3,943.65.
On the upside, the first resistance level is at $4,300; the next resistance is the 50-day moving average at approximately $4,438.42, followed by the 200-day moving average at $4,477.13; the 100-day moving average is at $4,663.13. As long as the downtrend structure doesn't reverse, this level will limit any rebound or correction in gold prices.
Despite a slight rebound in gold prices that day, the current quarter is still projected to be the worst quarterly performance for gold since 2013, erasing all gains made this year. Gold prices fell nearly 18% this quarter, with a monthly drop of approximately 11%, potentially marking the largest monthly decline since 2008.
The trigger for this decline in gold prices was the energy inflation shock caused by geopolitical conflicts in the Middle East, which led the market to reprice itself, raise its expectations for Federal Reserve rate hikes, and shift its overall stance towards hawkishness.
Logically, geopolitical tensions and rising inflation should benefit gold. However, higher interest rates will diminish gold's appeal—gold itself does not generate interest income, making it less competitive compared to interest-bearing assets.
Meanwhile, the uncertainty surrounding whether the US and Iran will begin a new round of negotiations in Qatar, coupled with market expectations that the Federal Reserve will raise lending rates in the second half of this year, has provided support for the US dollar.
The US Dollar Index (DXY), which measures the dollar's performance against a basket of six major currencies, is currently trading around 101.10 and is poised for its second consecutive monthly gain. A stronger dollar increases the cost of gold for overseas buyers, further pressuring gold prices.
Data from the CME FedWatch Tool shows that traders currently expect a 63% probability of a rate hike at the Federal Reserve's September meeting. Cleveland Federal Reserve Bank President Beth Hammark stated on Tuesday, "To bring inflation back to our target level, we may have to raise interest rates further," while also acknowledging, "I am concerned that a rate hike could have a negative impact on the rest of the economy."
The market will be closely watching this week's U.S. labor market data for clues about the Federal Reserve's future policy moves. The Job Openings and Labor Turnover Survey (JOLTS) released on Tuesday showed that U.S. job openings rose to 7.594 million in May, higher than the market expectation of 7.3 million.
The market's attention will now focus on the ADP private sector employment data to be released on Wednesday, followed by the non-farm payrolls (NFP) data on Thursday. Due to the July 4th Independence Day holiday, this year's NFP release is one day earlier than usual.
A series of upcoming employment data releases may determine the short-term direction of gold. The $4,000 level is a key psychological support level; as long as this level is not effectively broken, spot gold will likely remain range-bound near its recent lows.
Societe Generale strategists stated, "Although the current decline in gold prices has been overextended, there are currently no clear signs of a significant rebound. Even if gold prices experience a short-term rebound, the previous turning point high of $4,100 will be the first resistance level. Once gold prices fall below $3,885, the subsequent downside target will be $3,750, with the next target at $3,600."
Technical Analysis: The downtrend remains firm below key moving averages.
(Spot gold daily chart source: FX678)
On the daily chart, the short-term downtrend for spot gold remains unchanged, with the price trading significantly below the 50-day, 100-day, and 200-day simple moving averages (SMAs). These moving averages are MA50: $4438.42, MA100: $4663.13, and MA200: $4477.13, respectively, and are concentrated in the $4438.42-$4663.13 range.
Gold is currently attempting to stabilize above the $4,000 level. The Relative Strength Index (RSI) is at 35.33, still in the weak zone; the Directional Movement Index (ADX) is at 42, indicating that the current downward trend remains strong. This means that downward pressure is likely to continue until gold prices regain their footing above the key resistance level.
MACD indicator: DIFF=-122.02, DEA=-112.95, MACD histogram=-18.13, the bearish momentum has not yet completely exhausted.
On the downside, the first support level is the $4,000 support zone (current price $4,030.39). If this level is broken, gold prices will likely begin a new round of declines, with a potential low of $3,943.65.
On the upside, the first resistance level is at $4,300; the next resistance is the 50-day moving average at approximately $4,438.42, followed by the 200-day moving average at $4,477.13; the 100-day moving average is at $4,663.13. As long as the downtrend structure doesn't reverse, this level will limit any rebound or correction in gold prices.
- Risk Warning and Disclaimer
- The market involves risk, and trading may not be suitable for all investors. This article is for reference only and does not constitute personal investment advice, nor does it take into account certain users’ specific investment objectives, financial situation, or other needs. Any investment decisions made based on this information are at your own risk.