Silver is at $62, but the core of the next round of fluctuations is already clear.
2026-07-06 17:56:50
On Monday, July 6th, spot silver is currently fluctuating around $62 per ounce. After the US non-farm payroll data cooled down, the market's pricing in a July rate hike has clearly declined, but inflation remains above the policy target. As a result, silver is caught between "easing interest rate expectations" and "pressure on technical rebounds."
The latest macroeconomic clues are not simply bullish. June nonfarm payrolls increased by only 57,000, the unemployment rate was 4.2%, and the labor force participation rate fell to 61.5%. These figures have lessened the market's sense of urgency for further tightening of policies in the near term; however, employment has not deteriorated drastically, with growth in professional and business services, social assistance, and healthcare, indicating that macroeconomic pricing has not yet entered a typical recessionary trade.
Changes in interest rates are more crucial. The yield on the 10-year US Treasury note fell to approximately 4.46% on July 6th, while the 2-year yield was around 4.12%, and the US dollar index was around 101.08, a slight increase from the previous trading day. For silver, this means that real interest rate pressures have eased marginally, but the US dollar has not yet made a significant concession. In other words, silver prices are not currently simply benefiting from interest rate cuts, but rather are finding a new pricing anchor after fluctuating at high levels.
The Federal Reserve maintained its target range for the federal funds rate at 3.50% to 3.75% at its June meeting, while emphasizing that inflation remained above the 2% target and that some price pressures stemmed from supply shocks, such as those in the energy sector. This means traders cannot rely solely on non-farm payroll data; they must also place greater weight on the next inflation report.
The market pricing has shifted from "a near-term rate hike is more urgent" to "further meetings still offer flexibility." After the non-farm payrolls data was released, the probability of a July rate hike dropped from approximately 31.5% to approximately 21.9%, and the probability of a September rate hike dropped from approximately 64.3% to approximately 54.8%. This change explains why silver did not continue its sharp decline, but it also explains why the rebound lacks a basis for unilateral expansion.
Inflationary pressures continue. The US Consumer Price Index (CPI) rose 0.5% month-over-month and 4.2% year-over-year in May; the core CPI, excluding food and energy, rose 0.2% month-over-month and 2.9% year-over-year. Energy prices rose 3.9% month-over-month and 23.5% year-over-year in May, with gasoline prices rising by a staggering 40.5% year-over-year. June inflation data is scheduled for release on July 14th, which is the truly high-weighted event in the short-term volatility structure of silver.
From the daily chart, silver prices fell from a high of $71.531, briefly dipping to $55.585 before recovering, but the recovery slope was significantly weaker than the previous decline. Currently, the price is around $62, close to previous horizontal resistance and the upper edge of the short-term rebound, but still below the Bollinger Middle Band at $65.246. The upper Bollinger Band at $76.139 continues to move downwards, indicating that the medium-term trading range has not yet fully expanded, and the price remains in a consolidation range after a larger pullback.
Looking more closely at the Bollinger Bands, the lower band is starting to flatten around $54.352, indicating that the previous downward momentum has weakened; however, the middle band continues to decline, suggesting that the rebound has not yet changed the average system. The area around $63.243 is a recent high resistance level. If the price fails to break out of this area effectively, the market appears to be undergoing a post-fall correction rather than resuming an upward trend. The $61.478 level previously provided support with a lower shadow and is currently near a point where bullish and bearish forces are diverging again.
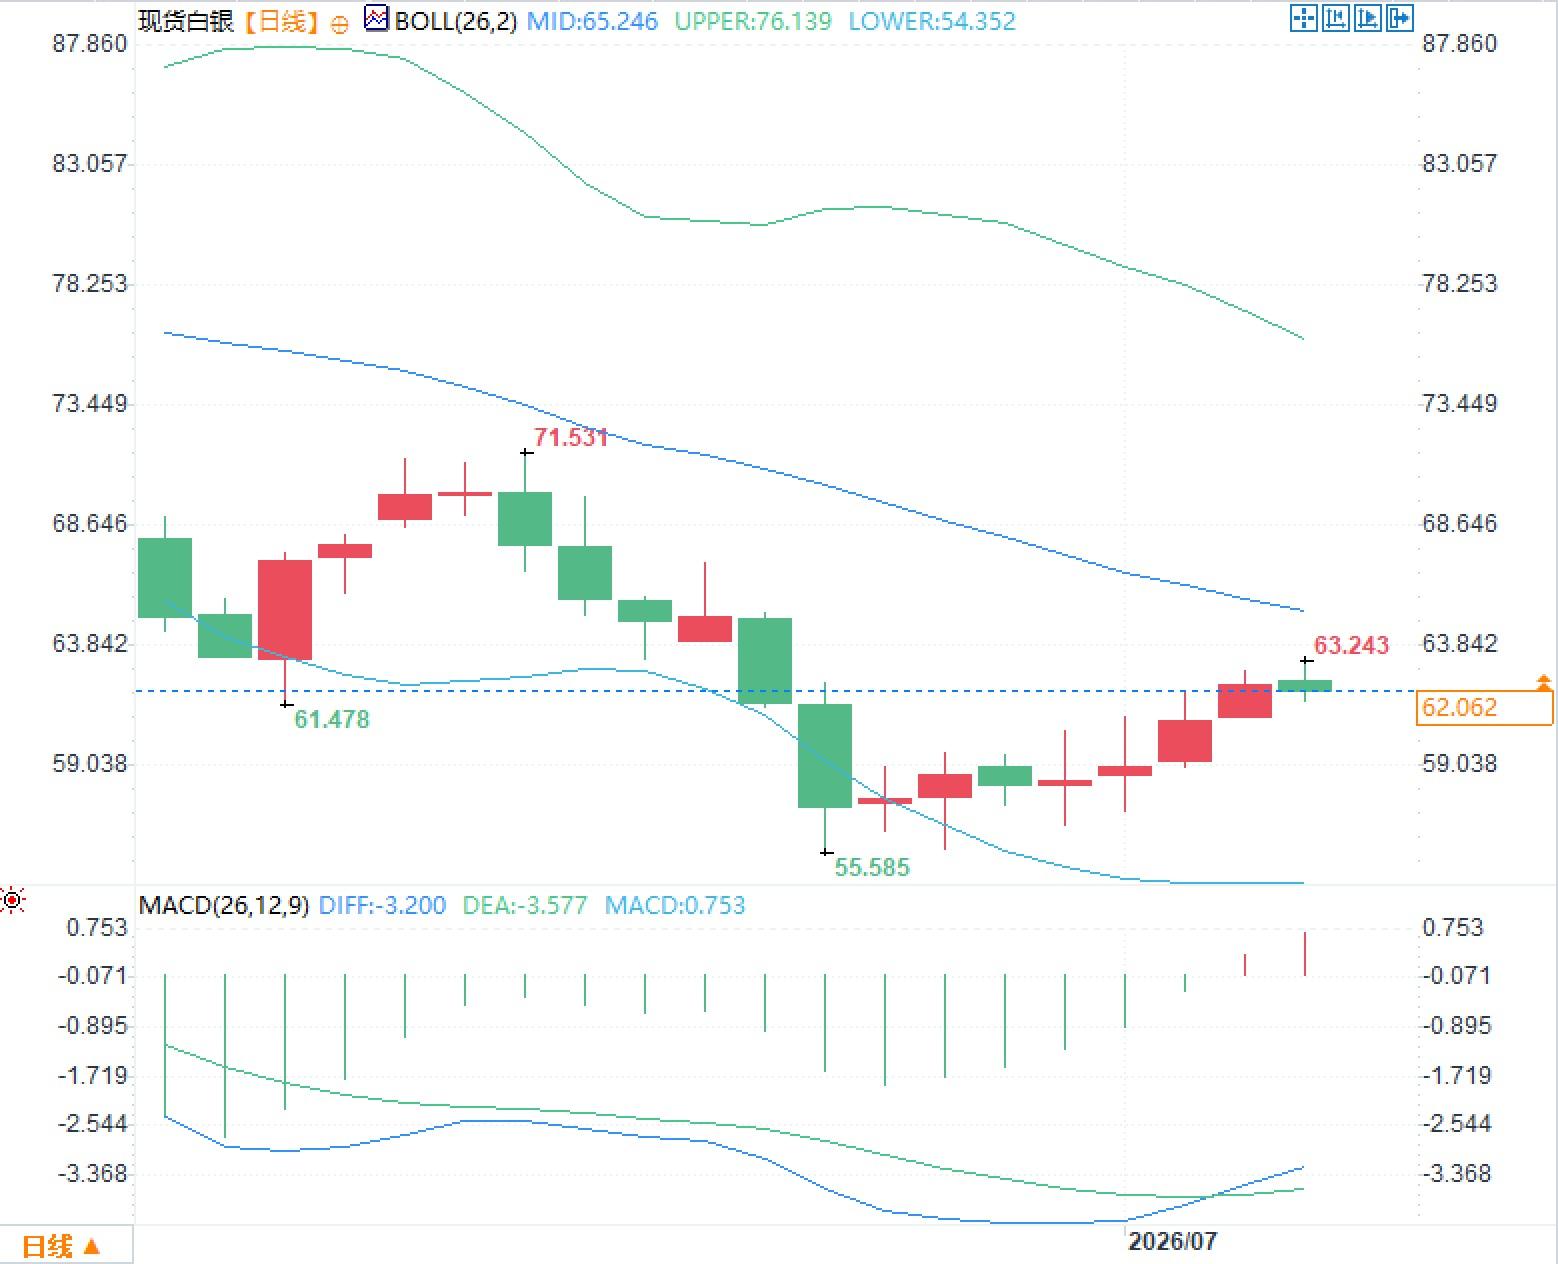
On the MACD level, the DIFF is -3.200 and the DEA is -3.577, with the histogram turning positive to 0.753, indicating a contraction in downward momentum and a short-term correction signal. However, both lines are still below the zero line, suggesting the trend has not yet reversed. If silver prices continue to trade sideways around $62, it's essentially waiting for policy and inflation data to provide direction, rather than a clear conclusion from the technical indicators.
The biggest difference between silver and gold lies in their dual nature. Silver has both the pricing logic of precious metals and the demand logic of industrial products. The global silver market is expected to experience a deficit for the sixth consecutive year in 2026, with total supply projected to increase by 1.5% to 1.05 billion ounces, mine production projected to grow by 1% to 820 million ounces, and recycling projected to increase by 7%, but overall this will still be insufficient to fully cover demand.
Demand was not strong across the board. Industrial processing demand is expected to decline by 2% to approximately 650 million ounces, mainly dragged down by silver savings and substitution in photovoltaics; however, data centers, artificial intelligence-related technologies, and automotive electronics continue to offset silver consumption. Physical investment demand is expected to grow by 20% to 227 million ounces, which explains why silver prices have remained resilient after a significant pullback.
Therefore, the core issue for silver at present is not "whether there is support," but rather "whether the support can offset the valuation pullback." Previous price volatility has led to limited adaptability of industrial users to high prices, and while the supply-demand gap will raise the long-term price level, it does not necessarily prevent short-term pullbacks.
Market Background: The rebound in silver prices is not driven by a single factor, but rather by the combined effects of interest rates, inflation, and portfolio rebalancing.
The latest macroeconomic clues are not simply bullish. June nonfarm payrolls increased by only 57,000, the unemployment rate was 4.2%, and the labor force participation rate fell to 61.5%. These figures have lessened the market's sense of urgency for further tightening of policies in the near term; however, employment has not deteriorated drastically, with growth in professional and business services, social assistance, and healthcare, indicating that macroeconomic pricing has not yet entered a typical recessionary trade.
Changes in interest rates are more crucial. The yield on the 10-year US Treasury note fell to approximately 4.46% on July 6th, while the 2-year yield was around 4.12%, and the US dollar index was around 101.08, a slight increase from the previous trading day. For silver, this means that real interest rate pressures have eased marginally, but the US dollar has not yet made a significant concession. In other words, silver prices are not currently simply benefiting from interest rate cuts, but rather are finding a new pricing anchor after fluctuating at high levels.
Policy variables: Cooling employment provides a buffer against interest rate hike pressures, but inflation remains a harder constraint.
The Federal Reserve maintained its target range for the federal funds rate at 3.50% to 3.75% at its June meeting, while emphasizing that inflation remained above the 2% target and that some price pressures stemmed from supply shocks, such as those in the energy sector. This means traders cannot rely solely on non-farm payroll data; they must also place greater weight on the next inflation report.
The market pricing has shifted from "a near-term rate hike is more urgent" to "further meetings still offer flexibility." After the non-farm payrolls data was released, the probability of a July rate hike dropped from approximately 31.5% to approximately 21.9%, and the probability of a September rate hike dropped from approximately 64.3% to approximately 54.8%. This change explains why silver did not continue its sharp decline, but it also explains why the rebound lacks a basis for unilateral expansion.
Inflationary pressures continue. The US Consumer Price Index (CPI) rose 0.5% month-over-month and 4.2% year-over-year in May; the core CPI, excluding food and energy, rose 0.2% month-over-month and 2.9% year-over-year. Energy prices rose 3.9% month-over-month and 23.5% year-over-year in May, with gasoline prices rising by a staggering 40.5% year-over-year. June inflation data is scheduled for release on July 14th, which is the truly high-weighted event in the short-term volatility structure of silver.
Technical Structure: The $62 level was not a strong breakout, but rather a test of the downtrend line's resistance.
From the daily chart, silver prices fell from a high of $71.531, briefly dipping to $55.585 before recovering, but the recovery slope was significantly weaker than the previous decline. Currently, the price is around $62, close to previous horizontal resistance and the upper edge of the short-term rebound, but still below the Bollinger Middle Band at $65.246. The upper Bollinger Band at $76.139 continues to move downwards, indicating that the medium-term trading range has not yet fully expanded, and the price remains in a consolidation range after a larger pullback.
Looking more closely at the Bollinger Bands, the lower band is starting to flatten around $54.352, indicating that the previous downward momentum has weakened; however, the middle band continues to decline, suggesting that the rebound has not yet changed the average system. The area around $63.243 is a recent high resistance level. If the price fails to break out of this area effectively, the market appears to be undergoing a post-fall correction rather than resuming an upward trend. The $61.478 level previously provided support with a lower shadow and is currently near a point where bullish and bearish forces are diverging again.
On the MACD level, the DIFF is -3.200 and the DEA is -3.577, with the histogram turning positive to 0.753, indicating a contraction in downward momentum and a short-term correction signal. However, both lines are still below the zero line, suggesting the trend has not yet reversed. If silver prices continue to trade sideways around $62, it's essentially waiting for policy and inflation data to provide direction, rather than a clear conclusion from the technical indicators.
Fundamental factors: Silver is supported by a supply-demand gap, but its price elasticity is constrained by cooling industrial demand.
The biggest difference between silver and gold lies in their dual nature. Silver has both the pricing logic of precious metals and the demand logic of industrial products. The global silver market is expected to experience a deficit for the sixth consecutive year in 2026, with total supply projected to increase by 1.5% to 1.05 billion ounces, mine production projected to grow by 1% to 820 million ounces, and recycling projected to increase by 7%, but overall this will still be insufficient to fully cover demand.
Demand was not strong across the board. Industrial processing demand is expected to decline by 2% to approximately 650 million ounces, mainly dragged down by silver savings and substitution in photovoltaics; however, data centers, artificial intelligence-related technologies, and automotive electronics continue to offset silver consumption. Physical investment demand is expected to grow by 20% to 227 million ounces, which explains why silver prices have remained resilient after a significant pullback.
Therefore, the core issue for silver at present is not "whether there is support," but rather "whether the support can offset the valuation pullback." Previous price volatility has led to limited adaptability of industrial users to high prices, and while the supply-demand gap will raise the long-term price level, it does not necessarily prevent short-term pullbacks.
- Risk Warning and Disclaimer
- The market involves risk, and trading may not be suitable for all investors. This article is for reference only and does not constitute personal investment advice, nor does it take into account certain users’ specific investment objectives, financial situation, or other needs. Any investment decisions made based on this information are at your own risk.