The Federal Reserve meeting minutes are due to be released this week, and the market is awaiting an official interpretation of the Fed's hawkish shift.
2026-07-06 18:39:25
The US dollar index has shown subtle structural changes since the start of this week. From a long-term perspective, the overall upward trend of the dollar has not been completely broken and its trend remains stable. However, the cooling of expectations for Federal Reserve policy and the continued weakening of upward momentum mean that the short-term direction of the dollar will depend entirely on the various policy signals and detailed interpretations released by the Federal Reserve in the coming days.
The statistical data from the correlation coefficient matrix clearly shows that the correlation between the US dollar index and the Federal Reserve's interest rate expectations has been rising rapidly recently. In just the past week, the correlation coefficient between the two surged to 0.88, forming a highly positive correlation. Looking at a longer time frame, while the medium- to long-term correlation has weakened slightly, it still maintains a stable positive relationship. The yield on the two-year US Treasury bond also maintains a positive correlation with the US dollar index, although the correlation strength is slightly lower.
This data characteristic fully confirms that the market's current predictions and speculations about the Fed's interest rate hikes and cuts have become the core driving force dominating the overall fluctuations of the US dollar, almost influencing the short-term trend of the dollar.
The federal funds rate futures market continues to correct its previously aggressive expectations, gradually digesting the hawkish signals released at the June FOMC meeting. As of now, market pricing indicates that the Fed's cumulative rate hikes by June 2027 will be only 36.5 basis points, a significant pullback from the over 50 basis point rate hike expectations at the end of June.
This shift in market expectations began with Federal Reserve Chairman Kevin Warsh's public remarks at the European Central Bank's Sintra Forum last week. On the one hand, Warsh maintained his hawkish stance, reiterating that all market investors who predicted the Fed would tolerate inflation remaining above the 2% target would ultimately face disappointment; on the other hand, he also unusually softened his stance, acknowledging that domestic inflation expectations had cooled significantly in recent weeks and that the overall risk of rising inflation had been greatly mitigated.
The US non-farm payroll data released last Thursday further fueled expectations of a loosening of Federal Reserve policy. The data showed that the US unemployment rate unexpectedly fell to 4.2%, but this decline was not due to a recovery in the job market; the core factor was a significant drop in the labor force participation rate, limiting its predictive value. Specifically, the number of new non-farm jobs fell short of market expectations, and the employment data for the previous two months were revised downwards accordingly. Household employment survey data further indicated a substantial increase in the number of unemployed. Meanwhile, the growth rate of average hourly wages did not rebound, eliminating the risk of a second wave of inflation triggered by sustained wage increases and completely dispelling market concerns about a chain reaction of inflationary pressures stemming from energy price shocks this year.
Inflation expectation data at the market trading level has further amplified the divergence between current market trends and the Federal Reserve's policy statements. Although the US five-year breakeven inflation rate is still higher than the Fed's 2% inflation target, it briefly fell below 2.2% at the end of last month and has now stabilized at 2.24%, which is at the low end of the inflation expectation fluctuation range of the past two years, and the signal of cooling inflation is very clear.
Objectively speaking, the hawkish tone of the June FOMC meeting suppressed market inflation expectations to some extent, pushing the breakeven inflation rate down. However, even considering this factor, there remains an irreconcilable contradiction between the policy predictions of the Fed members and the current fundamental environment. Of the 18 Fed members who participated in the economic forecast, 9 believe the Fed will need to raise interest rates at least once this year, and 6 predict multiple rate hikes this year.
Looking at the current market fundamentals, international energy prices have fallen sharply, the inflationary impact of geopolitical conflicts has gradually subsided, and medium-term inflation expectations have cooled significantly compared to the initial stages of the conflicts. This raises a core question in the market: Why has the Federal Reserve's policy stance shifted so dramatically in just six weeks? What is the underlying logic?
The answer may be revealed gradually this week.
There are no major core economic data releases scheduled for this week in the United States. Market sentiment will largely revolve around the Federal Reserve's actions, with key focus on the FOMC meeting minutes to be released on Wednesday, as well as public speeches by Federal Reserve Governor Christopher Waller and New York Fed President John Williams.
The minutes of the June meeting are expected to reveal in detail the underlying reasons for the Fed's collective shift to a hawkish stance that month and the disagreements among committee members. However, compared to the written minutes, the oral speeches of two key officials are more instructive in real time. Waller and Williams are both centrists within the Fed's hawkish-dove camp, maintaining a neutral and objective stance. Their remarks accurately reflect the overall policy inclination of the Fed Committee. Waller's statements, in particular, have always been a crucial leading indicator for predicting the FOMC's policy direction, making them highly valuable for reference.
Federal Reserve Chairman Warsh has made it clear that he will not provide the market with straightforward forward policy guidance. He even humorously remarked at the Sintra Forum that he would not "give the market the standard answer before the exam begins," deliberately preserving the flexibility and uncertainty of policy.
However, the market's biggest concern is whether other Federal Reserve members will follow the chairman's ambiguous policy stance. Months ago, Waller expressed a hawkish view, stating bluntly that discussing interest rate cuts at this time was premature and out of touch with market reality. Whether he will reiterate a clear policy signal this week and revise his previous views is the key focus for all forex traders.
Aside from the Federal Reserve's announcements, the US ISM Services Purchasing Managers' Index (PMI) released on Monday is the only economic data this week with significant market influence. However, investors shouldn't be overly concerned with the overall final value of the index; the detailed sub-indices are the key to judging the health of the service sector and inflation trends.
Last week, the US manufacturing prices paid index cooled significantly, indicating a marked easing of inflationary pressures in the manufacturing sector. The market will now focus on the performance of the services price sub-index to observe whether service sector inflation has also reached a cooling inflection point. If service sector price data weakens in tandem, it will further confirm the overall trend of continued easing in market inflation expectations.
Meanwhile, the service sector employment data is also highly valuable for reference. This year, non-farm payroll data has consistently demonstrated the resilience of the labor market, but several sub-indicators have shown significant divergence from the non-farm payroll figures: data from the Household Employment Survey and the Conference Board's Labour Balance continue to point to a weakening job market. If the service sector employment sub-indices also weaken this time, it will further confirm that the non-farm payroll data has become an outlier and fails to accurately reflect the overall state of the current US labor market.
In addition, the new orders data for the service sector is also worth paying close attention to. The continued decline in this data indicates that demand in the US end market continues to weaken, and the momentum of economic recovery may further cool down in the second half of the year.
The dollar's bullish trend faces a critical test.
Over the past week, the US dollar index (DXY) has weakened slightly from a technical perspective, showing minor signs of loosening in its price structure. However, the medium- to long-term upward trend that began from the May lows remains intact. Currently, the US dollar index is still holding above its 50-day, 100-day, and 200-day moving averages, and all three medium- to long-term moving averages maintain an upward-sloping bullish alignment, indicating that the overall bullish trend remains unchanged.
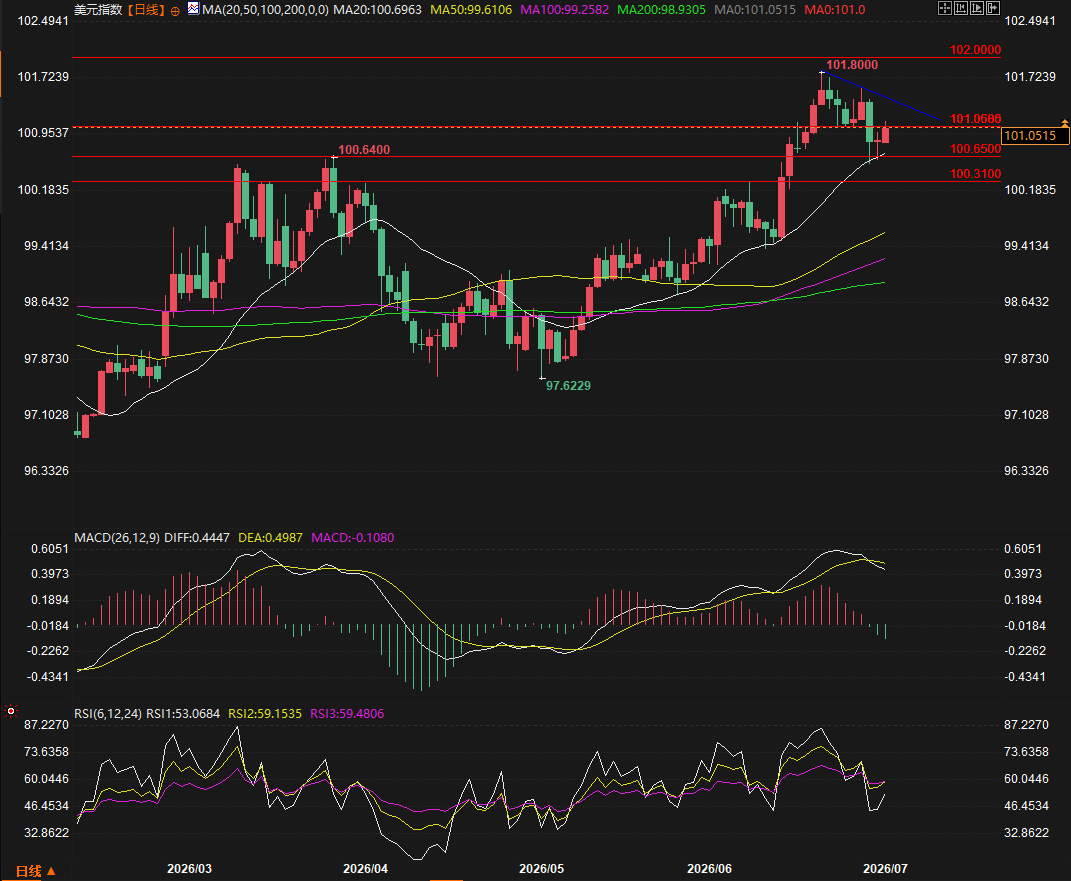
(US Dollar Index Daily Chart Source: FX678)
However, short-term market movements have already shown clear signs of weakening bullish momentum: the US dollar index has been in a short-term correction since its high of 101.80 on June 24, forming a clear downward channel; the 14-period Relative Strength Index (RSI) has turned downwards, reaching a secondary high; and the MACD indicator has also formed a death cross, even though it remains in positive territory overall, the signal of waning upward momentum is very clear. While these patterns do not constitute a strong bearish signal, they indicate that the recent months of strong unilateral appreciation of the US dollar has ended, and the market is about to enter a phase of struggle between bulls and bears.
Regarding support levels, 100.65 is the first key short-term support level for the US dollar index. This level successfully withstood selling pressure twice last week, triggering buying rebounds. It also corresponds to the high point at the end of March and is supported by the overall upward trend line since May, making it the most important support zone in the short term. The next key support is at 100.31, which is the key platform level the dollar broke through after the June Fed meeting. If both of these support levels are breached, market focus will shift to the 99.51 level. This level combines long-term support and resistance, has historically seen repeated shifts between bullish and bearish trends, and multiple medium- and long-term moving averages converge here, making it extremely strong support.
Regarding resistance levels, 101.06 is the first short-term resistance level. The US dollar index has been fluctuating around this level for the past two weeks, making it a key consolidation point for short-term price action. After an upward breakout, the market needs to pay close attention to the downward trend line extending from the June high, the recent high of 101.80, and the psychological resistance level of 102.00.
In summary, although the US dollar's technical indicators have weakened in the short term and its momentum has declined, its medium- to long-term upward trend remains solid, and there is still no complete and reliable logic for a one-sided bearish outlook. However, after last week's non-farm payroll data was released, the US dollar closed with a bearish engulfing candlestick pattern, coupled with the continued weakening of bullish momentum. The current profit-loss ratio of the bull-bear game has been completely reshaped, and it is no longer the extreme situation that was unilaterally favorable to the bulls.
Based on the above fundamental and technical analysis, after several months, I have adjusted my overall view on the US Dollar Index to neutral. The core trading logic must closely follow price signals; currently, the uncertainty surrounding the dollar's movement has increased significantly, and the era of predictable one-sided upward or downward movements is over.
The statistical data from the correlation coefficient matrix clearly shows that the correlation between the US dollar index and the Federal Reserve's interest rate expectations has been rising rapidly recently. In just the past week, the correlation coefficient between the two surged to 0.88, forming a highly positive correlation. Looking at a longer time frame, while the medium- to long-term correlation has weakened slightly, it still maintains a stable positive relationship. The yield on the two-year US Treasury bond also maintains a positive correlation with the US dollar index, although the correlation strength is slightly lower.
This data characteristic fully confirms that the market's current predictions and speculations about the Fed's interest rate hikes and cuts have become the core driving force dominating the overall fluctuations of the US dollar, almost influencing the short-term trend of the dollar.
The federal funds rate futures market continues to correct its previously aggressive expectations, gradually digesting the hawkish signals released at the June FOMC meeting. As of now, market pricing indicates that the Fed's cumulative rate hikes by June 2027 will be only 36.5 basis points, a significant pullback from the over 50 basis point rate hike expectations at the end of June.
This shift in market expectations began with Federal Reserve Chairman Kevin Warsh's public remarks at the European Central Bank's Sintra Forum last week. On the one hand, Warsh maintained his hawkish stance, reiterating that all market investors who predicted the Fed would tolerate inflation remaining above the 2% target would ultimately face disappointment; on the other hand, he also unusually softened his stance, acknowledging that domestic inflation expectations had cooled significantly in recent weeks and that the overall risk of rising inflation had been greatly mitigated.
The US non-farm payroll data released last Thursday further fueled expectations of a loosening of Federal Reserve policy. The data showed that the US unemployment rate unexpectedly fell to 4.2%, but this decline was not due to a recovery in the job market; the core factor was a significant drop in the labor force participation rate, limiting its predictive value. Specifically, the number of new non-farm jobs fell short of market expectations, and the employment data for the previous two months were revised downwards accordingly. Household employment survey data further indicated a substantial increase in the number of unemployed. Meanwhile, the growth rate of average hourly wages did not rebound, eliminating the risk of a second wave of inflation triggered by sustained wage increases and completely dispelling market concerns about a chain reaction of inflationary pressures stemming from energy price shocks this year.
Inflation expectation data at the market trading level has further amplified the divergence between current market trends and the Federal Reserve's policy statements. Although the US five-year breakeven inflation rate is still higher than the Fed's 2% inflation target, it briefly fell below 2.2% at the end of last month and has now stabilized at 2.24%, which is at the low end of the inflation expectation fluctuation range of the past two years, and the signal of cooling inflation is very clear.
Objectively speaking, the hawkish tone of the June FOMC meeting suppressed market inflation expectations to some extent, pushing the breakeven inflation rate down. However, even considering this factor, there remains an irreconcilable contradiction between the policy predictions of the Fed members and the current fundamental environment. Of the 18 Fed members who participated in the economic forecast, 9 believe the Fed will need to raise interest rates at least once this year, and 6 predict multiple rate hikes this year.
Looking at the current market fundamentals, international energy prices have fallen sharply, the inflationary impact of geopolitical conflicts has gradually subsided, and medium-term inflation expectations have cooled significantly compared to the initial stages of the conflicts. This raises a core question in the market: Why has the Federal Reserve's policy stance shifted so dramatically in just six weeks? What is the underlying logic?
The answer may be revealed gradually this week.
There are no major core economic data releases scheduled for this week in the United States. Market sentiment will largely revolve around the Federal Reserve's actions, with key focus on the FOMC meeting minutes to be released on Wednesday, as well as public speeches by Federal Reserve Governor Christopher Waller and New York Fed President John Williams.
The minutes of the June meeting are expected to reveal in detail the underlying reasons for the Fed's collective shift to a hawkish stance that month and the disagreements among committee members. However, compared to the written minutes, the oral speeches of two key officials are more instructive in real time. Waller and Williams are both centrists within the Fed's hawkish-dove camp, maintaining a neutral and objective stance. Their remarks accurately reflect the overall policy inclination of the Fed Committee. Waller's statements, in particular, have always been a crucial leading indicator for predicting the FOMC's policy direction, making them highly valuable for reference.
Federal Reserve Chairman Warsh has made it clear that he will not provide the market with straightforward forward policy guidance. He even humorously remarked at the Sintra Forum that he would not "give the market the standard answer before the exam begins," deliberately preserving the flexibility and uncertainty of policy.
However, the market's biggest concern is whether other Federal Reserve members will follow the chairman's ambiguous policy stance. Months ago, Waller expressed a hawkish view, stating bluntly that discussing interest rate cuts at this time was premature and out of touch with market reality. Whether he will reiterate a clear policy signal this week and revise his previous views is the key focus for all forex traders.
Aside from the Federal Reserve's announcements, the US ISM Services Purchasing Managers' Index (PMI) released on Monday is the only economic data this week with significant market influence. However, investors shouldn't be overly concerned with the overall final value of the index; the detailed sub-indices are the key to judging the health of the service sector and inflation trends.
Last week, the US manufacturing prices paid index cooled significantly, indicating a marked easing of inflationary pressures in the manufacturing sector. The market will now focus on the performance of the services price sub-index to observe whether service sector inflation has also reached a cooling inflection point. If service sector price data weakens in tandem, it will further confirm the overall trend of continued easing in market inflation expectations.
Meanwhile, the service sector employment data is also highly valuable for reference. This year, non-farm payroll data has consistently demonstrated the resilience of the labor market, but several sub-indicators have shown significant divergence from the non-farm payroll figures: data from the Household Employment Survey and the Conference Board's Labour Balance continue to point to a weakening job market. If the service sector employment sub-indices also weaken this time, it will further confirm that the non-farm payroll data has become an outlier and fails to accurately reflect the overall state of the current US labor market.
In addition, the new orders data for the service sector is also worth paying close attention to. The continued decline in this data indicates that demand in the US end market continues to weaken, and the momentum of economic recovery may further cool down in the second half of the year.
The dollar's bullish trend faces a critical test.
Over the past week, the US dollar index (DXY) has weakened slightly from a technical perspective, showing minor signs of loosening in its price structure. However, the medium- to long-term upward trend that began from the May lows remains intact. Currently, the US dollar index is still holding above its 50-day, 100-day, and 200-day moving averages, and all three medium- to long-term moving averages maintain an upward-sloping bullish alignment, indicating that the overall bullish trend remains unchanged.
(US Dollar Index Daily Chart Source: FX678)
However, short-term market movements have already shown clear signs of weakening bullish momentum: the US dollar index has been in a short-term correction since its high of 101.80 on June 24, forming a clear downward channel; the 14-period Relative Strength Index (RSI) has turned downwards, reaching a secondary high; and the MACD indicator has also formed a death cross, even though it remains in positive territory overall, the signal of waning upward momentum is very clear. While these patterns do not constitute a strong bearish signal, they indicate that the recent months of strong unilateral appreciation of the US dollar has ended, and the market is about to enter a phase of struggle between bulls and bears.
Regarding support levels, 100.65 is the first key short-term support level for the US dollar index. This level successfully withstood selling pressure twice last week, triggering buying rebounds. It also corresponds to the high point at the end of March and is supported by the overall upward trend line since May, making it the most important support zone in the short term. The next key support is at 100.31, which is the key platform level the dollar broke through after the June Fed meeting. If both of these support levels are breached, market focus will shift to the 99.51 level. This level combines long-term support and resistance, has historically seen repeated shifts between bullish and bearish trends, and multiple medium- and long-term moving averages converge here, making it extremely strong support.
Regarding resistance levels, 101.06 is the first short-term resistance level. The US dollar index has been fluctuating around this level for the past two weeks, making it a key consolidation point for short-term price action. After an upward breakout, the market needs to pay close attention to the downward trend line extending from the June high, the recent high of 101.80, and the psychological resistance level of 102.00.
In summary, although the US dollar's technical indicators have weakened in the short term and its momentum has declined, its medium- to long-term upward trend remains solid, and there is still no complete and reliable logic for a one-sided bearish outlook. However, after last week's non-farm payroll data was released, the US dollar closed with a bearish engulfing candlestick pattern, coupled with the continued weakening of bullish momentum. The current profit-loss ratio of the bull-bear game has been completely reshaped, and it is no longer the extreme situation that was unilaterally favorable to the bulls.
Based on the above fundamental and technical analysis, after several months, I have adjusted my overall view on the US Dollar Index to neutral. The core trading logic must closely follow price signals; currently, the uncertainty surrounding the dollar's movement has increased significantly, and the era of predictable one-sided upward or downward movements is over.
- Risk Warning and Disclaimer
- The market involves risk, and trading may not be suitable for all investors. This article is for reference only and does not constitute personal investment advice, nor does it take into account certain users’ specific investment objectives, financial situation, or other needs. Any investment decisions made based on this information are at your own risk.