













Crude oil market: Traders are closely watching the 52-week moving average, awaiting a potential price reversal.
2026-07-07 00:37:09
Both WTI and Brent crude oil closed lower on the weekly chart. Shipping conditions in the Strait of Hormuz continued to improve; OPEC+ finalized a new round of production increases for August; and both Goldman Sachs and JPMorgan Chase lowered their oil price forecasts. The supply disruption panic that supported oil prices this spring has completely dissipated, and crude oil has yet to find a valid bottom.
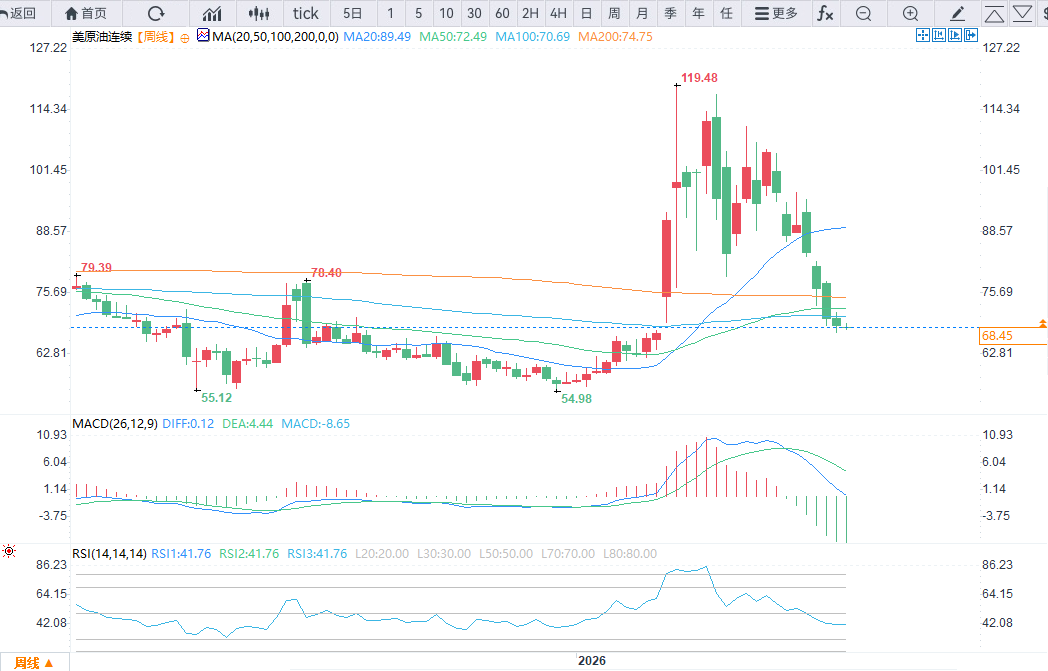
Technical Analysis of August WTI Crude Oil Futures Weekly Chart
From the weekly chart, WTI crude oil futures for August delivery are generally in a downtrend. If the price breaks below $67.04, the downtrend will be confirmed to continue, with the next target being the December low of $55.40.
Only if the price breaks through $100.10 will the main trend turn upward, but the possibility of this happening in the short term is extremely low.
While the short-term trend is unlikely to reverse in the near term, oil prices have fallen for seven consecutive weeks from their recent highs. From a time cycle perspective, the market is poised to form a closing price reversal bottom pattern. This technical pattern cannot directly reverse the overall trend, but it could potentially initiate a counter-trend rebound lasting two to three weeks.
(WTI crude oil weekly chart source: FX678)
If the support level of $67.04, the low of last week, holds, a reversal bottom pattern will fail to form, and the market will likely form a W-bottom pattern. This pattern usually indicates weakening selling momentum and gradually increasing buying power. The initial rebound in this round was mainly driven by short covering. Given the current backdrop of a sharp drop in oil prices, the market must establish a solid support range; otherwise, both the rebound's scope and duration will be very limited.
Another key indicator to watch this week is the 52-week moving average, currently at $68.55. Last week, oil prices fluctuated around this moving average, even dipping to $67.40 intraday before closing above it. The outcome of trading activity around this moving average will directly determine the overall tone of oil prices this week.
If oil prices continue to hold above the 52-week moving average, a rebound could be triggered by short covering, but the 61.8% Fibonacci retracement level at $72.48 will provide significant resistance in the short term. A successful break above this level would extend the rebound to the 50% Fibonacci retracement level at $77.75. My personal assessment is that a break above $77.75 would be a key trigger for a faster upward move in oil prices.
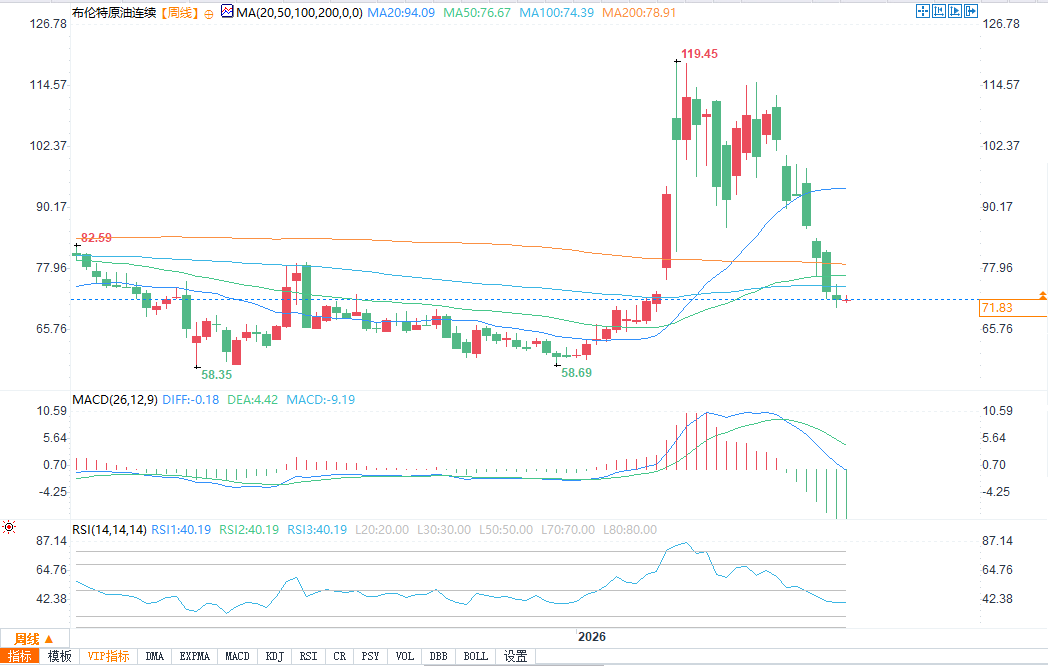
Technical Analysis of September Brent Crude Oil Futures Weekly Chart
The weekly chart shows that Brent crude oil futures for September delivery are also in a downtrend. A break below $70.14 would signal a resumption of the downtrend; if selling pressure continues, the December low of $58.83 will become the next target.
(Brent crude oil weekly chart source: FX678)
If the price breaks below $70.14 during the day but recovers sharply by the close, it will form a closing price reversal bottom pattern. If this pattern is confirmed next week, it may trigger a 2-3 week counter-trend rebound.
If a reversal bottom cannot be formed, the market may form a W-bottom pattern, driven by both short covering and active counter-trend bottom buying. The success or failure of this pattern depends on the 52-week moving average of $72.26.
If Brent crude oil holds above $72.26 this week, the rebound will first test the short-term 61.8% Fibonacci resistance level of $75.80; after breaking through this point, the upside potential will extend to the short-term 50% Fibonacci resistance level of $81.04, which is a key watershed for a significant rise in oil prices.
If buying pressure fails to hold the 52-week moving average support, the market may experience a sharp drop due to concentrated liquidation, or a slow, gradual decline, eventually reaching a low of $58.83.
The continued recovery in shipping in the Strait of Hormuz continues to drag down oil prices.
Following the implementation of the interim US-Iran agreement, tanker traffic in the Strait of Hormuz has rebounded, although it has not yet returned to pre-conflict levels. Shipping insurance costs remain high, and some shipping companies are maintaining a cautious approach. However, shipping has been steadily recovering since the agreement was signed, and oil prices have been gradually absorbing this positive supply expectation.
Crude oil exports from Saudi Arabia and several Gulf oil-producing countries rebounded sharply in June; reports that Abu Dhabi had to increase crude oil discounts to reduce its inventory demonstrate that the crude oil market quickly turned into a buyer's market after shipping resumed.
This US-Iran agreement is only a temporary agreement, and no permanent treaty has been signed. If a conflict were to erupt in the Gulf region, oil prices would immediately re-induce the geopolitical risk premium. However, at present, no such event has occurred, and the market is no longer paying a geopolitical risk premium.
OPEC+ has increased production for the fifth consecutive time, abandoning its price support strategy.
OPEC+ approved a daily crude oil production increase of 188,000 barrels in August, marking the fifth consecutive month of production quota increases. While some member countries were unable to meet their committed production targets due to capacity and equipment constraints, the alliance as a whole continued to release crude oil supply without introducing any supporting measures to stabilize oil prices.
At the same time, non-OPEC oil-producing countries are expanding their crude oil supply, and the spot crude oil price spread continues to widen. The oil price increase this spring was entirely based on the geopolitical risk of supply disruptions; now, with OPEC+ and non-OPEC oil-producing countries increasing supply simultaneously, the bullish logic that previously supported oil prices has been completely undermined.
Major investment banks are collectively bearish, with Goldman Sachs being relatively optimistic.
Following the interim agreement between the US and Iran, Goldman Sachs lowered its Brent crude oil price forecast for next year to around $75, which is already in line with market expectations. Goldman Sachs also warned of potential upside risks: if global crude oil inventories decline and shipping in the Strait of Hormuz is disrupted, oil prices may still have room to rise, but the baseline forecast has still been lowered.
JPMorgan Chase is even more pessimistic, predicting Brent crude oil prices will only reach around $60 next year. Their reasoning includes continued new oil supply, slowing global oil demand growth, and Chinese oil consumption this year falling far short of market expectations. Industry surveys corroborate these investment bank views, with analysts across the industry collectively lowering their oil price forecasts. OPEC and the International Energy Agency (IEA) have both lowered their global oil demand growth forecasts, both concluding that oil consumption growth is unlikely to reach previously predicted levels.
This week's focus will be on market catalysts.
Shipping data from the Strait of Hormuz and the U.S. Energy Information Administration's (EIA) crude oil inventory report are the two core data sources driving oil prices this week. OPEC and the International Energy Agency will also update their supply and demand assessment reports, with both agencies lowering their demand growth forecasts, primarily due to weaker-than-expected Chinese consumption.
OPEC+ has just finalized its fifth consecutive round of production increases, and the market generally expects this production increase cycle to continue. Only a significant decrease in crude oil inventories, as reported by the EIA, could potentially break the current overwhelmingly bearish market sentiment; any other data will allow short sellers to control the price action near resistance levels.
Currently, WTI and Brent crude oil have been falling from their recent highs for seven weeks, with prices closely following the 52-week moving average, and no clear reversal technical signal has yet appeared. Once the moving average support is breached, the first support level below will be the low point of last December.
Technical Analysis of August WTI Crude Oil Futures Weekly Chart
From the weekly chart, WTI crude oil futures for August delivery are generally in a downtrend. If the price breaks below $67.04, the downtrend will be confirmed to continue, with the next target being the December low of $55.40.
Only if the price breaks through $100.10 will the main trend turn upward, but the possibility of this happening in the short term is extremely low.
While the short-term trend is unlikely to reverse in the near term, oil prices have fallen for seven consecutive weeks from their recent highs. From a time cycle perspective, the market is poised to form a closing price reversal bottom pattern. This technical pattern cannot directly reverse the overall trend, but it could potentially initiate a counter-trend rebound lasting two to three weeks.
(WTI crude oil weekly chart source: FX678)
If the support level of $67.04, the low of last week, holds, a reversal bottom pattern will fail to form, and the market will likely form a W-bottom pattern. This pattern usually indicates weakening selling momentum and gradually increasing buying power. The initial rebound in this round was mainly driven by short covering. Given the current backdrop of a sharp drop in oil prices, the market must establish a solid support range; otherwise, both the rebound's scope and duration will be very limited.
Another key indicator to watch this week is the 52-week moving average, currently at $68.55. Last week, oil prices fluctuated around this moving average, even dipping to $67.40 intraday before closing above it. The outcome of trading activity around this moving average will directly determine the overall tone of oil prices this week.
If oil prices continue to hold above the 52-week moving average, a rebound could be triggered by short covering, but the 61.8% Fibonacci retracement level at $72.48 will provide significant resistance in the short term. A successful break above this level would extend the rebound to the 50% Fibonacci retracement level at $77.75. My personal assessment is that a break above $77.75 would be a key trigger for a faster upward move in oil prices.
Technical Analysis of September Brent Crude Oil Futures Weekly Chart
The weekly chart shows that Brent crude oil futures for September delivery are also in a downtrend. A break below $70.14 would signal a resumption of the downtrend; if selling pressure continues, the December low of $58.83 will become the next target.
(Brent crude oil weekly chart source: FX678)
If the price breaks below $70.14 during the day but recovers sharply by the close, it will form a closing price reversal bottom pattern. If this pattern is confirmed next week, it may trigger a 2-3 week counter-trend rebound.
If a reversal bottom cannot be formed, the market may form a W-bottom pattern, driven by both short covering and active counter-trend bottom buying. The success or failure of this pattern depends on the 52-week moving average of $72.26.
If Brent crude oil holds above $72.26 this week, the rebound will first test the short-term 61.8% Fibonacci resistance level of $75.80; after breaking through this point, the upside potential will extend to the short-term 50% Fibonacci resistance level of $81.04, which is a key watershed for a significant rise in oil prices.
If buying pressure fails to hold the 52-week moving average support, the market may experience a sharp drop due to concentrated liquidation, or a slow, gradual decline, eventually reaching a low of $58.83.
The continued recovery in shipping in the Strait of Hormuz continues to drag down oil prices.
Following the implementation of the interim US-Iran agreement, tanker traffic in the Strait of Hormuz has rebounded, although it has not yet returned to pre-conflict levels. Shipping insurance costs remain high, and some shipping companies are maintaining a cautious approach. However, shipping has been steadily recovering since the agreement was signed, and oil prices have been gradually absorbing this positive supply expectation.
Crude oil exports from Saudi Arabia and several Gulf oil-producing countries rebounded sharply in June; reports that Abu Dhabi had to increase crude oil discounts to reduce its inventory demonstrate that the crude oil market quickly turned into a buyer's market after shipping resumed.
This US-Iran agreement is only a temporary agreement, and no permanent treaty has been signed. If a conflict were to erupt in the Gulf region, oil prices would immediately re-induce the geopolitical risk premium. However, at present, no such event has occurred, and the market is no longer paying a geopolitical risk premium.
OPEC+ has increased production for the fifth consecutive time, abandoning its price support strategy.
OPEC+ approved a daily crude oil production increase of 188,000 barrels in August, marking the fifth consecutive month of production quota increases. While some member countries were unable to meet their committed production targets due to capacity and equipment constraints, the alliance as a whole continued to release crude oil supply without introducing any supporting measures to stabilize oil prices.
At the same time, non-OPEC oil-producing countries are expanding their crude oil supply, and the spot crude oil price spread continues to widen. The oil price increase this spring was entirely based on the geopolitical risk of supply disruptions; now, with OPEC+ and non-OPEC oil-producing countries increasing supply simultaneously, the bullish logic that previously supported oil prices has been completely undermined.
Major investment banks are collectively bearish, with Goldman Sachs being relatively optimistic.
Following the interim agreement between the US and Iran, Goldman Sachs lowered its Brent crude oil price forecast for next year to around $75, which is already in line with market expectations. Goldman Sachs also warned of potential upside risks: if global crude oil inventories decline and shipping in the Strait of Hormuz is disrupted, oil prices may still have room to rise, but the baseline forecast has still been lowered.
JPMorgan Chase is even more pessimistic, predicting Brent crude oil prices will only reach around $60 next year. Their reasoning includes continued new oil supply, slowing global oil demand growth, and Chinese oil consumption this year falling far short of market expectations. Industry surveys corroborate these investment bank views, with analysts across the industry collectively lowering their oil price forecasts. OPEC and the International Energy Agency (IEA) have both lowered their global oil demand growth forecasts, both concluding that oil consumption growth is unlikely to reach previously predicted levels.
This week's focus will be on market catalysts.
Shipping data from the Strait of Hormuz and the U.S. Energy Information Administration's (EIA) crude oil inventory report are the two core data sources driving oil prices this week. OPEC and the International Energy Agency will also update their supply and demand assessment reports, with both agencies lowering their demand growth forecasts, primarily due to weaker-than-expected Chinese consumption.
OPEC+ has just finalized its fifth consecutive round of production increases, and the market generally expects this production increase cycle to continue. Only a significant decrease in crude oil inventories, as reported by the EIA, could potentially break the current overwhelmingly bearish market sentiment; any other data will allow short sellers to control the price action near resistance levels.
Currently, WTI and Brent crude oil have been falling from their recent highs for seven weeks, with prices closely following the 52-week moving average, and no clear reversal technical signal has yet appeared. Once the moving average support is breached, the first support level below will be the low point of last December.
- Risk Warning and Disclaimer
- The market involves risk, and trading may not be suitable for all investors. This article is for reference only and does not constitute personal investment advice, nor does it take into account certain users’ specific investment objectives, financial situation, or other needs. Any investment decisions made based on this information are at your own risk.

