Spot gold is poised for a third consecutive decline, while the Hormuz situation is pushing up oil prices; the FOMC minutes will be key.
2026-07-08 16:42:57
On Wednesday (July 8), spot gold continued to decline during the European session, currently trading around $4,100 per ounce, and is on track for its third consecutive day of losses.
Geopolitical tensions in the Strait of Hormuz continue to escalate. Iran is attempting to consolidate its control over this strategic waterway and plans to charge vessels passing through it fees—Tehran emphasizes that these fees will be used for security, vessel oversight, and environmental protection, not simply as "passage fees." This move has drawn strong opposition from the United States, but Iran's stance remains firm.
Meanwhile, a maritime agency reported that an oil tanker was attacked by unidentified projectiles while transiting the Strait of Hormuz. This incident further strained the already fragile US-Iran peace agreement and provided support for oil prices. Rising oil prices reignited market concerns about rising inflation, which in turn pushed up US Treasury yields and put some downward pressure on gold prices.
The weak June U.S. nonfarm payrolls report prompted the market to lower its bets on a Federal Reserve rate hike. Traders revised their expectations from 1-2 rate hikes in 2026 to 0-1 hikes. This decline in rate hike expectations made dollar bulls more cautious, limiting the downside potential for gold to some extent.
In terms of economic data, the US ISM Services PMI for June came in at 54.0, a slight decrease from the previous reading of 54.5, in line with market expectations and failing to provide additional support for the US dollar.
Investors are currently cautious, reluctant to build large positions, and are generally waiting for more clues about the Federal Reserve's policy path. Therefore, market focus has shifted to the release of the FOMC minutes on Wednesday.
Furthermore, further developments in the geopolitical situation will continue to influence demand for the US dollar and provide new trading opportunities for gold prices.
Given the aforementioned fundamental background, investors should remain cautious and wait for clearer signals of continued selling pressure before confirming whether the rebound following last week's low has ended.
JPMorgan Chase recently lowered its short-term gold forecast for 2026, but maintained a highly bullish long-term outlook. It currently expects gold prices to reach approximately $4,300/oz in Q3 and rise to approximately $4,500/oz in Q4 (previously a higher target of $6,000), attributed to a short-term slowdown in investor demand, a strong dollar, and uncertainty surrounding Federal Reserve policy (potentially raising interest rates earlier than expected to address inflation).
Nevertheless, the bank emphasized that the long-term bull market logic remains intact, and expects gold prices to rebound to $6,000 by the end of 2026 and further to around $6,300 in 2027.
Commerzbank stated that the average gold price in 2026 will be around $4,631 per ounce, with Q4 closing around $4,800. The target for 2027 is $5,300, mainly reflecting a short-term correction due to macroeconomic headwinds, but strong support from central bank demand and long-term diversification trends.
The bank believes that while weak employment data is a short-term positive for gold (weakening bets on interest rate hikes), high yields and a strong dollar still dominate the market, limiting the extent of the rebound. Emerging market central bank purchases continue to be the main buying activity, and Western ETFs are expected to see a return of funds following the Fed's shift in policy.
According to the daily chart, spot gold has been in a continuous downward trend since the high of 4773.37. The price has fallen in steps, reaching a low of 3943.65 before rebounding. The moving averages are clearly in a bearish pattern. The short-term MA20 (4142.04), medium-term MA50, and MA100 are all putting downward pressure on the gold price. The price is under pressure below the 20-day moving average, with only the MA200 far above. The medium- to long-term downtrend has not been reversed.
In terms of indicators, the MACD is running below the zero axis, the DIFF line crosses the DEA to form a golden cross at a low level, the red bars continue to increase in volume, the downward momentum of the bears has weakened significantly, and the short-term rebound momentum is sufficient; the RSI indicator has continued to rise from the oversold zone, and the current RSI1 value is 50.29, which has not yet reached the 70 overbought threshold, so there is still room for short-term upward correction.
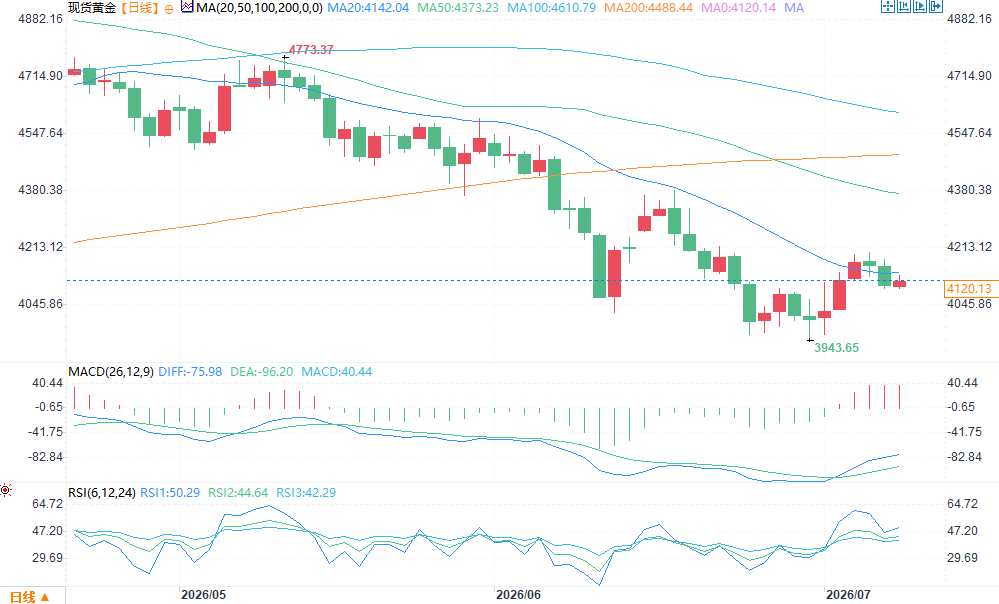
(Spot gold daily chart, source: FX678)
At 16:20 Beijing time on July 8, spot gold was trading at $4095.40 per ounce.
The ongoing conflict in the Hormuz region and rising oil prices have fueled inflation concerns.
Geopolitical tensions in the Strait of Hormuz continue to escalate. Iran is attempting to consolidate its control over this strategic waterway and plans to charge vessels passing through it fees—Tehran emphasizes that these fees will be used for security, vessel oversight, and environmental protection, not simply as "passage fees." This move has drawn strong opposition from the United States, but Iran's stance remains firm.
Meanwhile, a maritime agency reported that an oil tanker was attacked by unidentified projectiles while transiting the Strait of Hormuz. This incident further strained the already fragile US-Iran peace agreement and provided support for oil prices. Rising oil prices reignited market concerns about rising inflation, which in turn pushed up US Treasury yields and put some downward pressure on gold prices.
Weak US jobs data cools expectations for a Federal Reserve rate hike.
The weak June U.S. nonfarm payrolls report prompted the market to lower its bets on a Federal Reserve rate hike. Traders revised their expectations from 1-2 rate hikes in 2026 to 0-1 hikes. This decline in rate hike expectations made dollar bulls more cautious, limiting the downside potential for gold to some extent.
In terms of economic data, the US ISM Services PMI for June came in at 54.0, a slight decrease from the previous reading of 54.5, in line with market expectations and failing to provide additional support for the US dollar.
Market Focus: FOMC Minutes as a Key Catalyst
Investors are currently cautious, reluctant to build large positions, and are generally waiting for more clues about the Federal Reserve's policy path. Therefore, market focus has shifted to the release of the FOMC minutes on Wednesday.
Furthermore, further developments in the geopolitical situation will continue to influence demand for the US dollar and provide new trading opportunities for gold prices.
Given the aforementioned fundamental background, investors should remain cautious and wait for clearer signals of continued selling pressure before confirming whether the rebound following last week's low has ended.
Institutional Views
JPMorgan Chase recently lowered its short-term gold forecast for 2026, but maintained a highly bullish long-term outlook. It currently expects gold prices to reach approximately $4,300/oz in Q3 and rise to approximately $4,500/oz in Q4 (previously a higher target of $6,000), attributed to a short-term slowdown in investor demand, a strong dollar, and uncertainty surrounding Federal Reserve policy (potentially raising interest rates earlier than expected to address inflation).
Nevertheless, the bank emphasized that the long-term bull market logic remains intact, and expects gold prices to rebound to $6,000 by the end of 2026 and further to around $6,300 in 2027.
Commerzbank stated that the average gold price in 2026 will be around $4,631 per ounce, with Q4 closing around $4,800. The target for 2027 is $5,300, mainly reflecting a short-term correction due to macroeconomic headwinds, but strong support from central bank demand and long-term diversification trends.
The bank believes that while weak employment data is a short-term positive for gold (weakening bets on interest rate hikes), high yields and a strong dollar still dominate the market, limiting the extent of the rebound. Emerging market central bank purchases continue to be the main buying activity, and Western ETFs are expected to see a return of funds following the Fed's shift in policy.
Technical Analysis
According to the daily chart, spot gold has been in a continuous downward trend since the high of 4773.37. The price has fallen in steps, reaching a low of 3943.65 before rebounding. The moving averages are clearly in a bearish pattern. The short-term MA20 (4142.04), medium-term MA50, and MA100 are all putting downward pressure on the gold price. The price is under pressure below the 20-day moving average, with only the MA200 far above. The medium- to long-term downtrend has not been reversed.
In terms of indicators, the MACD is running below the zero axis, the DIFF line crosses the DEA to form a golden cross at a low level, the red bars continue to increase in volume, the downward momentum of the bears has weakened significantly, and the short-term rebound momentum is sufficient; the RSI indicator has continued to rise from the oversold zone, and the current RSI1 value is 50.29, which has not yet reached the 70 overbought threshold, so there is still room for short-term upward correction.
(Spot gold daily chart, source: FX678)
At 16:20 Beijing time on July 8, spot gold was trading at $4095.40 per ounce.
- Risk Warning and Disclaimer
- The market involves risk, and trading may not be suitable for all investors. This article is for reference only and does not constitute personal investment advice, nor does it take into account certain users’ specific investment objectives, financial situation, or other needs. Any investment decisions made based on this information are at your own risk.