US crude oil has broken through a key range; the real test is at $77.93.
2026-07-08 22:01:18
On Wednesday, July 8th, supply risk once again took over as the main driver of crude oil pricing. WTI crude oil is currently trading around $74 per barrel, having reached a daily high of around $75.30 per barrel, while Brent crude oil briefly rose above $79 per barrel, showing significantly increased short-term volatility. More importantly, this rebound is not solely driven by improved demand expectations, but rather by a combination of factors including shipping risks in the Strait of Hormuz, restrictions on Iranian oil sales, declining US commercial inventories, and rising inflation expectations.

The core reason for this round of oil price increases is the market's repricing of risks associated with Middle Eastern energy transportation. During the NATO summit, US President Trump stated that the memorandum regarding Iran had concluded and that he did not wish to continue negotiations. Subsequently, market focus shifted from "localized disturbances" to "whether shipping security will continue to be compromised." As a crucial energy passage, any decline in the efficiency of commercial vessel passage through the Strait of Hormuz will lead to a corresponding increase in spot purchasing, shipping schedules, insurance costs, and risk premiums for near-month contracts.
From a technical perspective, WTI crude oil prices did not rise slowly, but rather experienced a rapid surge driven by events. The daily chart shows that after rebounding from around $67.04 per barrel, oil prices broke through the $74 per barrel level, reaching an intraday high of $75.30 per barrel, indicating that short covering and risk premium trading occurred simultaneously. However, the price has not yet broken above the Bollinger Middle Band at $77.93 per barrel, suggesting that the trend reversal is not yet complete. The current situation appears more like a recovery driven by supply shocks than a comprehensive strengthening of the demand cycle.
US energy data provided real support for oil prices. The latest weekly data showed that for the week ending June 26, US refinery crude oil input averaged 17.2 million barrels per day, an increase of 85,000 barrels per day from the previous week, with refinery utilization reaching 96.6%. Commercial crude oil inventories decreased by 3.8 million barrels to 408.4 million barrels, about 7% lower than the five-year average for the same period; gasoline inventories decreased by 2.3 million barrels, also about 7% lower than the five-year average.
The implications of this data are clear: with refinery operating at high capacity, declining crude oil inventories indicate that short-term supply and demand are not loose, especially when shipping risks escalate, as low inventories amplify the volatility of near-month contracts. However, demand is not entirely strong. Gasoline supply averaged 9 million barrels per day over the past four weeks, down 2.6% year-on-year; distillate fuel oil supply averaged 3.7 million barrels per day, down 1.9% year-on-year. This means that the main driver of rising oil prices remains supply chain risks, rather than a broad expansion in end-consumer demand.
The impact of the crude oil rebound on macro trading is mainly reflected in inflation expectations and the Federal Reserve's policy path. A June survey by the New York Fed showed that one-year inflation expectations rose to 3.7% from 3.5% in May, the highest since September 2023; three-year inflation expectations rose to 3.3%, while five-year expectations remained at 3.0%. However, in the same survey, gasoline price growth expectations fell by 3.5 percentage points to 1.5%, indicating that consumers' perception of short-term energy prices has not fully followed the rise in crude oil prices.
This is precisely the complexity of the current oil market. If oil prices are merely experiencing a short-term, event-driven surge, the inflation trade may remain at the level of risk premium; however, if transportation disruptions drag on and are transmitted to the prices of refined oil products such as gasoline, diesel, and jet fuel, the market's pricing in the Federal Reserve maintaining high interest rates for an extended period will continue to strengthen. Federal Reserve official Williams previously emphasized that if energy prices fall, overall inflation is expected to decline, and the current policy position can balance dual objectives. The current issue is that the oil price rebound is testing the stability of this assessment.
From a technical perspective, WTI crude oil is still in a rebound phase after entering a medium-term downtrend channel on the daily chart. The Bollinger Band middle line is at $77.93 per barrel, higher than the current price range, indicating that the trend pressure has not yet been relieved. The large gap between the upper band at $96.11 per barrel and the lower band at $59.74 per barrel reflects the previously high volatility. As for the MACD, the DIF is -4.86, the DEA is -5.63, and the histogram has turned positive to 1.55, indicating a marginal convergence of downward momentum, but this is not enough to confirm a resumption of the medium-term bullish trend.
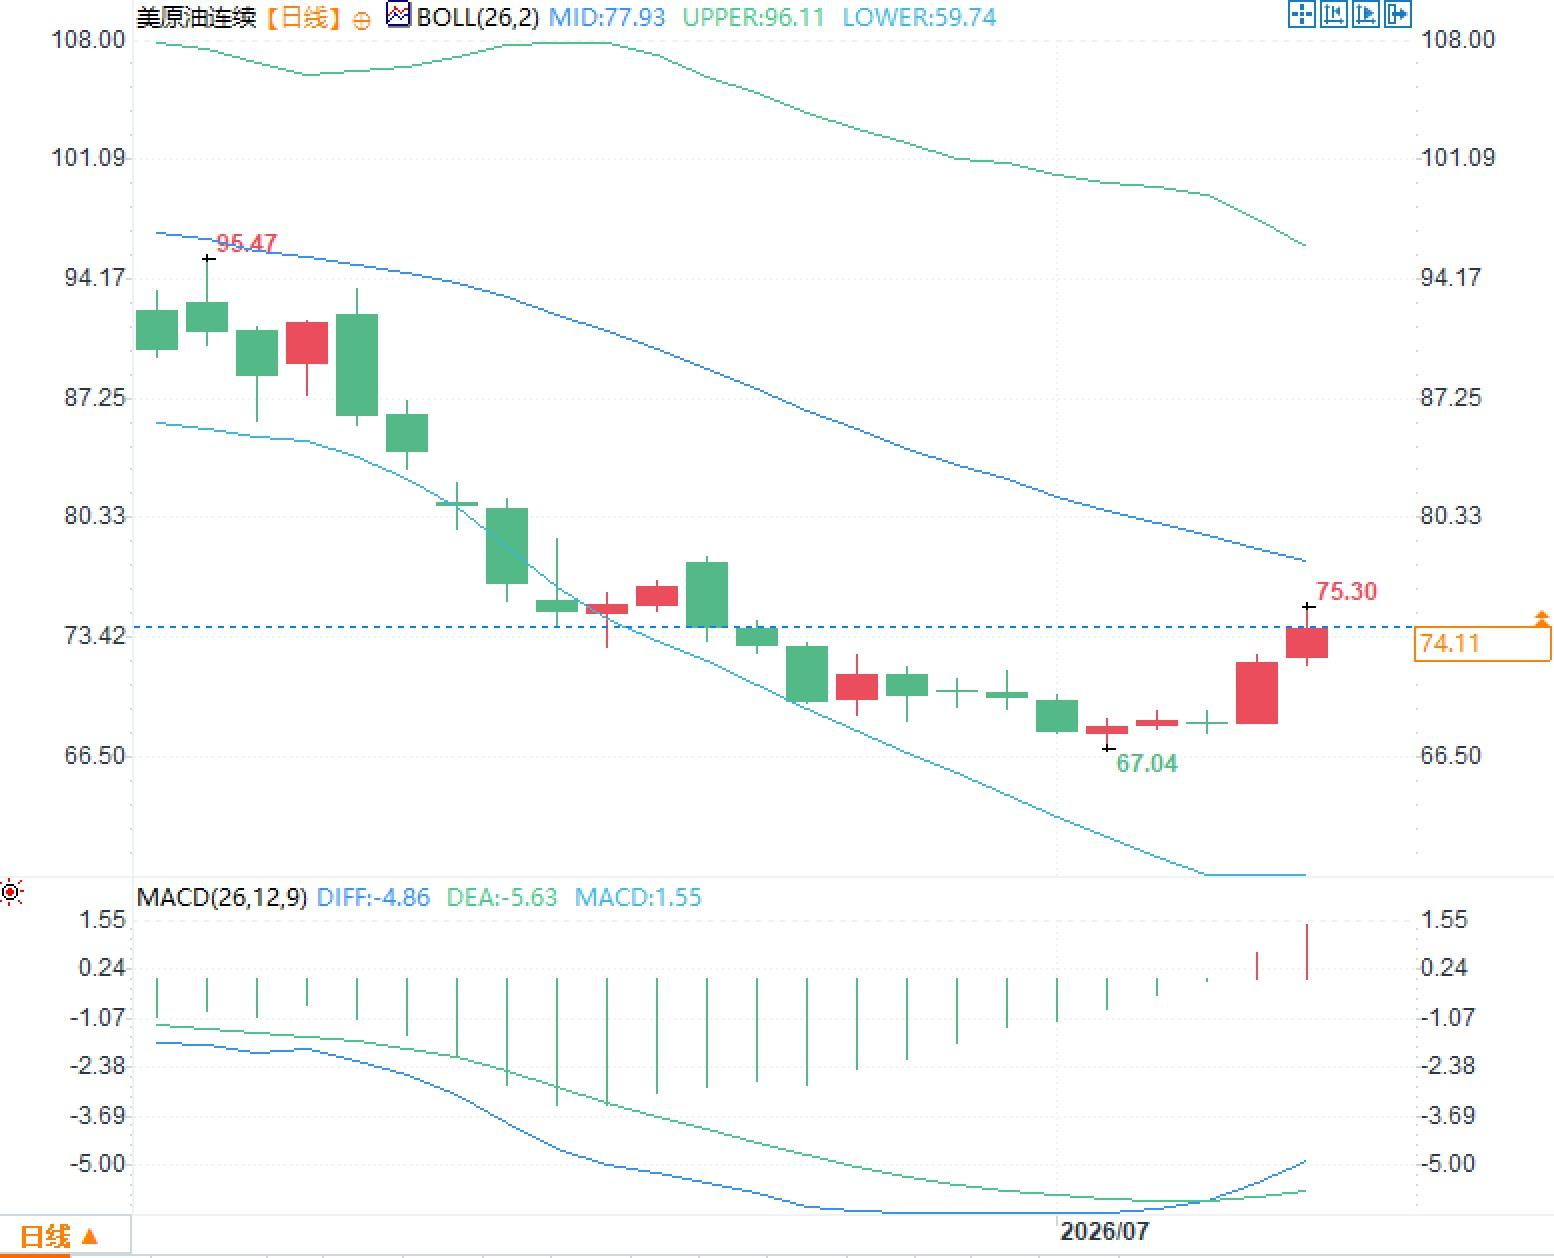
In the short term, the area around $74 per barrel has shifted from resistance to a key level separating bulls from bears. $75.30 per barrel represents the first high after the event-driven shock, while $77.93 per barrel is a more important trend confirmation zone. If prices fail to effectively approach and digest the middle band resistance, it indicates that the rebound is more driven by risk premiums than by a fundamental reassessment. Only if the near-month spread continues to widen while inventories continue to decline can the market further revise its pricing of shortage risks upwards.
Supply risks are being repriced, and the oil price rebound is not an isolated phenomenon.
The core reason for this round of oil price increases is the market's repricing of risks associated with Middle Eastern energy transportation. During the NATO summit, US President Trump stated that the memorandum regarding Iran had concluded and that he did not wish to continue negotiations. Subsequently, market focus shifted from "localized disturbances" to "whether shipping security will continue to be compromised." As a crucial energy passage, any decline in the efficiency of commercial vessel passage through the Strait of Hormuz will lead to a corresponding increase in spot purchasing, shipping schedules, insurance costs, and risk premiums for near-month contracts.
From a technical perspective, WTI crude oil prices did not rise slowly, but rather experienced a rapid surge driven by events. The daily chart shows that after rebounding from around $67.04 per barrel, oil prices broke through the $74 per barrel level, reaching an intraday high of $75.30 per barrel, indicating that short covering and risk premium trading occurred simultaneously. However, the price has not yet broken above the Bollinger Middle Band at $77.93 per barrel, suggesting that the trend reversal is not yet complete. The current situation appears more like a recovery driven by supply shocks than a comprehensive strengthening of the demand cycle.
Inventory levels provided support, but demand signals were not overwhelmingly optimistic.
US energy data provided real support for oil prices. The latest weekly data showed that for the week ending June 26, US refinery crude oil input averaged 17.2 million barrels per day, an increase of 85,000 barrels per day from the previous week, with refinery utilization reaching 96.6%. Commercial crude oil inventories decreased by 3.8 million barrels to 408.4 million barrels, about 7% lower than the five-year average for the same period; gasoline inventories decreased by 2.3 million barrels, also about 7% lower than the five-year average.
The implications of this data are clear: with refinery operating at high capacity, declining crude oil inventories indicate that short-term supply and demand are not loose, especially when shipping risks escalate, as low inventories amplify the volatility of near-month contracts. However, demand is not entirely strong. Gasoline supply averaged 9 million barrels per day over the past four weeks, down 2.6% year-on-year; distillate fuel oil supply averaged 3.7 million barrels per day, down 1.9% year-on-year. This means that the main driver of rising oil prices remains supply chain risks, rather than a broad expansion in end-consumer demand.
Rising inflation expectations are influencing the interest rate narrative due to crude oil prices.
The impact of the crude oil rebound on macro trading is mainly reflected in inflation expectations and the Federal Reserve's policy path. A June survey by the New York Fed showed that one-year inflation expectations rose to 3.7% from 3.5% in May, the highest since September 2023; three-year inflation expectations rose to 3.3%, while five-year expectations remained at 3.0%. However, in the same survey, gasoline price growth expectations fell by 3.5 percentage points to 1.5%, indicating that consumers' perception of short-term energy prices has not fully followed the rise in crude oil prices.
This is precisely the complexity of the current oil market. If oil prices are merely experiencing a short-term, event-driven surge, the inflation trade may remain at the level of risk premium; however, if transportation disruptions drag on and are transmitted to the prices of refined oil products such as gasoline, diesel, and jet fuel, the market's pricing in the Federal Reserve maintaining high interest rates for an extended period will continue to strengthen. Federal Reserve official Williams previously emphasized that if energy prices fall, overall inflation is expected to decline, and the current policy position can balance dual objectives. The current issue is that the oil price rebound is testing the stability of this assessment.
The technical structure remains biased towards recovery; $77.93 per barrel is a key level to watch.
From a technical perspective, WTI crude oil is still in a rebound phase after entering a medium-term downtrend channel on the daily chart. The Bollinger Band middle line is at $77.93 per barrel, higher than the current price range, indicating that the trend pressure has not yet been relieved. The large gap between the upper band at $96.11 per barrel and the lower band at $59.74 per barrel reflects the previously high volatility. As for the MACD, the DIF is -4.86, the DEA is -5.63, and the histogram has turned positive to 1.55, indicating a marginal convergence of downward momentum, but this is not enough to confirm a resumption of the medium-term bullish trend.
In the short term, the area around $74 per barrel has shifted from resistance to a key level separating bulls from bears. $75.30 per barrel represents the first high after the event-driven shock, while $77.93 per barrel is a more important trend confirmation zone. If prices fail to effectively approach and digest the middle band resistance, it indicates that the rebound is more driven by risk premiums than by a fundamental reassessment. Only if the near-month spread continues to widen while inventories continue to decline can the market further revise its pricing of shortage risks upwards.
- Risk Warning and Disclaimer
- The market involves risk, and trading may not be suitable for all investors. This article is for reference only and does not constitute personal investment advice, nor does it take into account certain users’ specific investment objectives, financial situation, or other needs. Any investment decisions made based on this information are at your own risk.