Before Brent crude rebounds to $80, the market is recalculating the probability of a supply disruption.
2026-07-09 20:39:03
On Thursday, July 9th, the main driver in the crude oil market was not simply risk appetite, but rather the repricing of risks associated with passage through the Strait of Hormuz, inventory cycles, and inflation expectations. Brent crude was currently trading around $78.5 per barrel, down approximately 15.50% over the past month. Oil prices have retreated from conflict premium highs but have not yet broken free from risk premium trading.

The trigger for this round of oil price movements was the renewed increase in the risk of passage through the Strait of Hormuz due to security incidents involving the US and Iran. The market initially priced in supply disruptions, but then gave back some of the gains due to conciliatory statements. For traders, the key is not to judge the strength of a single day's news, but to determine whether the risk premium has shifted from "supply disruption insurance" to "delayed passage costs."
This distinction is crucial. If it's merely a localized increase in shipping rates and insurance costs, oil prices typically show front-end contracts outperforming long-term contracts, with increased volatility but limited trend sustainability. However, if it evolves into disruptions to actual loading, settlement, and transshipment, refineries will be forced to rearrange their purchasing schedules, leading to a more systematic upward shift in the long-term curve. The U.S. Energy Information Administration, in its short-term outlook, projects that global oil inventories will decline by an average of 5.1 million barrels per day in the second quarter, and may continue to decline by 2.2 million barrels per day in the third quarter, but may turn to an average accumulation of 2.7 million barrels per day in the fourth quarter, with the accumulation potentially widening to 5 million barrels per day by 2027. In other words, the current tension stems from pressure on the spot market and transportation, and cannot be simply equated with a long-term supply-demand gap.
The latest weekly data is not entirely bullish for oil prices. U.S. commercial crude oil inventories increased by 3 million barrels to 411.4 million barrels, still about 6% below the five-year average. On the surface, the unexpected increase in crude oil inventories should weaken the narrative of tight supply, but the refined product side deserves more attention. Gasoline inventories decreased by 1.9 million barrels, and distillate fuel inventories decreased by 5 million barrels, with distillate fuel inventories about 12% below the five-year average. This suggests that there may be restocking or import disruptions on the crude oil side, while the refined product side still has support from cracking margins.
Refineries are also showing signs of marginal pressure after operating at high capacity. Last week, refinery crude oil input was 17 million barrels per day, a decrease of 173,000 barrels per day from the previous week, but the operating rate remained as high as 95.8%. At this level, there is limited room for further increases in processing volume. If finished product inventories remain low, the downside for oil prices will not only be determined by crude oil inventories, but also by the marginal restocking demand for gasoline, diesel, and jet fuel. In other words, the current crude oil market is not a traditional "increased inventory equals bearish" scenario, but rather a structural game between crude oil inventories, finished product inventories, and refinery operating rates.
Next, the market will turn its attention to the US June consumer price data. In May, the US CPI rose 0.5% month-on-month and 4.2% year-on-year; core CPI rose 0.2% month-on-month and 2.9% year-on-year. Among them, the energy index rose 3.9% month-on-month and 23.5% year-on-year in May, with gasoline prices rising 40.5% year-on-year. This data explains why oil prices still have spillover effects on macro assets; energy prices not only affect immediate consumption but also change market perceptions of the Federal Reserve's policy path.
The Federal Reserve maintained its target range for the federal funds rate at 3.5% to 3.75% in June, noting that inflation remained above the 2% target and that supply shocks, particularly in energy, were one source of price pressure. If subsequent CPI figures are lower than expected, crude oil could receive two layers of support: first, demand expectations would no longer be suppressed by tightening logic; and second, financial conditions would ease marginally. However, if the data exceeds expectations, oil prices will face more complex pressures, including macroeconomic pressures from interest rate reassessment and concerns that energy inflation could negatively impact demand.
Looking at the daily chart for Brent crude oil, the price is around $78.50 per barrel, below the Bollinger Band middle line at $80.35 per barrel, the upper band at $96.37 per barrel, and the lower band at $64.33 per barrel. A rebound occurred after the recent low of $70.13 per barrel, but a stable breakout above $80.56 per barrel has not yet been achieved. Regarding the MACD, the DIFF is -4.29, the DEA is -5.55, and the histogram has turned positive to 2.51, indicating weakening downward momentum and a corrective trading session underway. However, the moving average system has not yet confirmed a trend reversal.
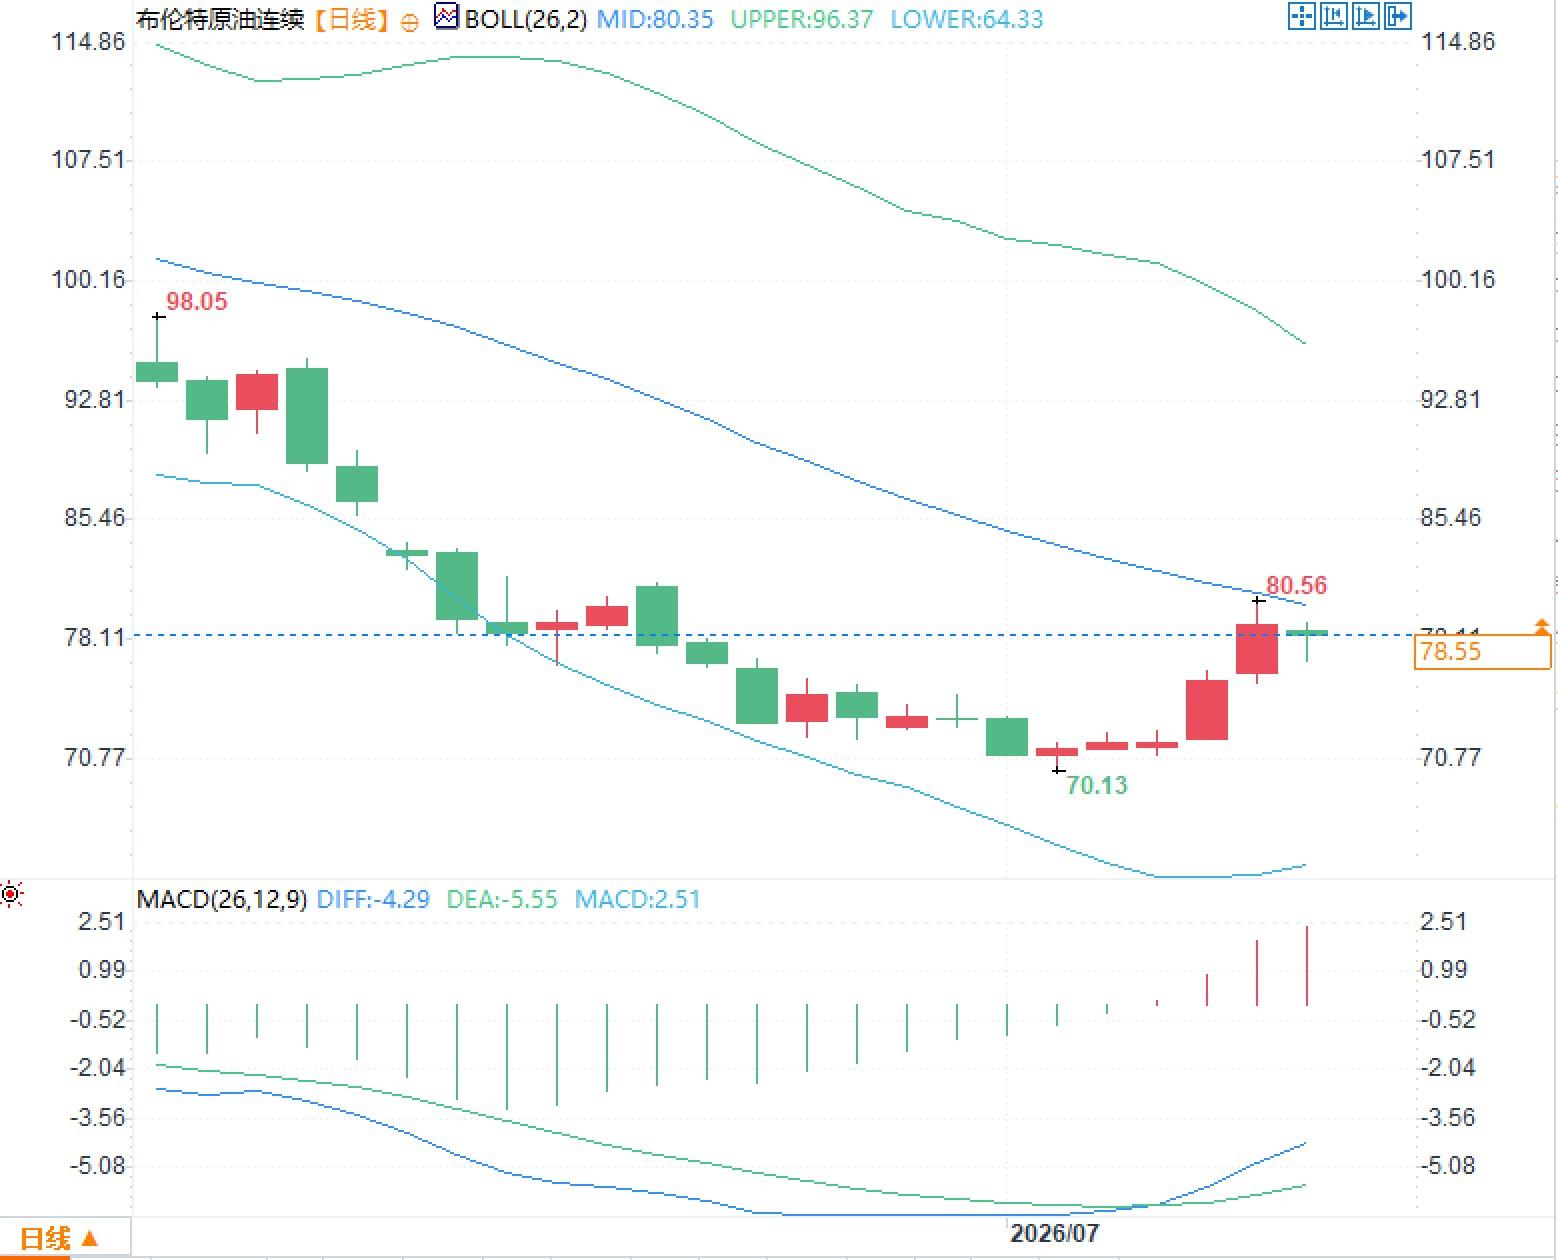
Therefore, the current market is more akin to a "rebalancing after the risk premium has fallen" rather than a resumption of a one-sided trend. Technically, the area around $78 to $80 per barrel is where the conflict premium, the Bollinger Middle Band, and short-term profit-taking converge. If the news environment continues to ease, prices will be suppressed by inventory expectations and macroeconomic interest rate logic; if cross-strait traffic is disrupted again, front-end contracts and refined product crack spreads may be more sensitive than spot prices alone.
Risk premiums have declined, but cross-strait variables have not been cleared.
The trigger for this round of oil price movements was the renewed increase in the risk of passage through the Strait of Hormuz due to security incidents involving the US and Iran. The market initially priced in supply disruptions, but then gave back some of the gains due to conciliatory statements. For traders, the key is not to judge the strength of a single day's news, but to determine whether the risk premium has shifted from "supply disruption insurance" to "delayed passage costs."
This distinction is crucial. If it's merely a localized increase in shipping rates and insurance costs, oil prices typically show front-end contracts outperforming long-term contracts, with increased volatility but limited trend sustainability. However, if it evolves into disruptions to actual loading, settlement, and transshipment, refineries will be forced to rearrange their purchasing schedules, leading to a more systematic upward shift in the long-term curve. The U.S. Energy Information Administration, in its short-term outlook, projects that global oil inventories will decline by an average of 5.1 million barrels per day in the second quarter, and may continue to decline by 2.2 million barrels per day in the third quarter, but may turn to an average accumulation of 2.7 million barrels per day in the fourth quarter, with the accumulation potentially widening to 5 million barrels per day by 2027. In other words, the current tension stems from pressure on the spot market and transportation, and cannot be simply equated with a long-term supply-demand gap.
Inventory data does not provide a single signal.
The latest weekly data is not entirely bullish for oil prices. U.S. commercial crude oil inventories increased by 3 million barrels to 411.4 million barrels, still about 6% below the five-year average. On the surface, the unexpected increase in crude oil inventories should weaken the narrative of tight supply, but the refined product side deserves more attention. Gasoline inventories decreased by 1.9 million barrels, and distillate fuel inventories decreased by 5 million barrels, with distillate fuel inventories about 12% below the five-year average. This suggests that there may be restocking or import disruptions on the crude oil side, while the refined product side still has support from cracking margins.
Refineries are also showing signs of marginal pressure after operating at high capacity. Last week, refinery crude oil input was 17 million barrels per day, a decrease of 173,000 barrels per day from the previous week, but the operating rate remained as high as 95.8%. At this level, there is limited room for further increases in processing volume. If finished product inventories remain low, the downside for oil prices will not only be determined by crude oil inventories, but also by the marginal restocking demand for gasoline, diesel, and jet fuel. In other words, the current crude oil market is not a traditional "increased inventory equals bearish" scenario, but rather a structural game between crude oil inventories, finished product inventories, and refinery operating rates.
Inflation data will be the pricing anchor for the next round.
Next, the market will turn its attention to the US June consumer price data. In May, the US CPI rose 0.5% month-on-month and 4.2% year-on-year; core CPI rose 0.2% month-on-month and 2.9% year-on-year. Among them, the energy index rose 3.9% month-on-month and 23.5% year-on-year in May, with gasoline prices rising 40.5% year-on-year. This data explains why oil prices still have spillover effects on macro assets; energy prices not only affect immediate consumption but also change market perceptions of the Federal Reserve's policy path.
The Federal Reserve maintained its target range for the federal funds rate at 3.5% to 3.75% in June, noting that inflation remained above the 2% target and that supply shocks, particularly in energy, were one source of price pressure. If subsequent CPI figures are lower than expected, crude oil could receive two layers of support: first, demand expectations would no longer be suppressed by tightening logic; and second, financial conditions would ease marginally. However, if the data exceeds expectations, oil prices will face more complex pressures, including macroeconomic pressures from interest rate reassessment and concerns that energy inflation could negatively impact demand.
Technical analysis suggests the rebound is still in the correction phase.
Looking at the daily chart for Brent crude oil, the price is around $78.50 per barrel, below the Bollinger Band middle line at $80.35 per barrel, the upper band at $96.37 per barrel, and the lower band at $64.33 per barrel. A rebound occurred after the recent low of $70.13 per barrel, but a stable breakout above $80.56 per barrel has not yet been achieved. Regarding the MACD, the DIFF is -4.29, the DEA is -5.55, and the histogram has turned positive to 2.51, indicating weakening downward momentum and a corrective trading session underway. However, the moving average system has not yet confirmed a trend reversal.
Therefore, the current market is more akin to a "rebalancing after the risk premium has fallen" rather than a resumption of a one-sided trend. Technically, the area around $78 to $80 per barrel is where the conflict premium, the Bollinger Middle Band, and short-term profit-taking converge. If the news environment continues to ease, prices will be suppressed by inventory expectations and macroeconomic interest rate logic; if cross-strait traffic is disrupted again, front-end contracts and refined product crack spreads may be more sensitive than spot prices alone.
- Risk Warning and Disclaimer
- The market involves risk, and trading may not be suitable for all investors. This article is for reference only and does not constitute personal investment advice, nor does it take into account certain users’ specific investment objectives, financial situation, or other needs. Any investment decisions made based on this information are at your own risk.