Gold price movements depend on CPI data, Warsh's statements, and geopolitical risks in the Strait of Hormuz.
2026-07-13 19:58:12
Earlier this month, a weaker dollar briefly boosted gold prices, with the market generally expecting the upward trend to continue. However, the situation reversed after the release of the Federal Open Market Committee (FOMC) meeting minutes. Warsh's FOMC clearly stated that the Fed would not initiate an easing cycle in the face of persistently high inflation; market expectations for interest rate cuts cooled significantly, and gold's upward momentum stalled, but a deep decline has not yet begun. CPI data and Warsh's testimony will both be released on Tuesday, and the market reaction on that day alone will determine whether buying pressure will return or whether the current consolidation will evolve into a deeper decline.  Last week, spot gold closed at $4120.67 per ounce, down $55.02, or 1.32%. Spot Gold Weekly Technical Analysis Last week, spot gold closed at $4120.67, down $55.02, or 1.32%. Just a week ago, gold prices formed a closing reversal low at $3942.10, but contrarian traders who tried to buy at the bottom did not profit. Last week's weak closing performance suggests that short sellers are likely to enter the market this week. Based on the weekly chart, the overall trend remains downward; the recent high is at $4891.54. Only a break above this level will reverse the overall trend upward. Currently, this price level is too high for a breakout, making it highly unlikely. Therefore, I am waiting for gold prices to form a tight W pattern at a lower level, which will provide a better buying opportunity. Once gold prices fall below $3942.10, this potential bullish reversal pattern will be invalidated, and the downtrend will resume.
 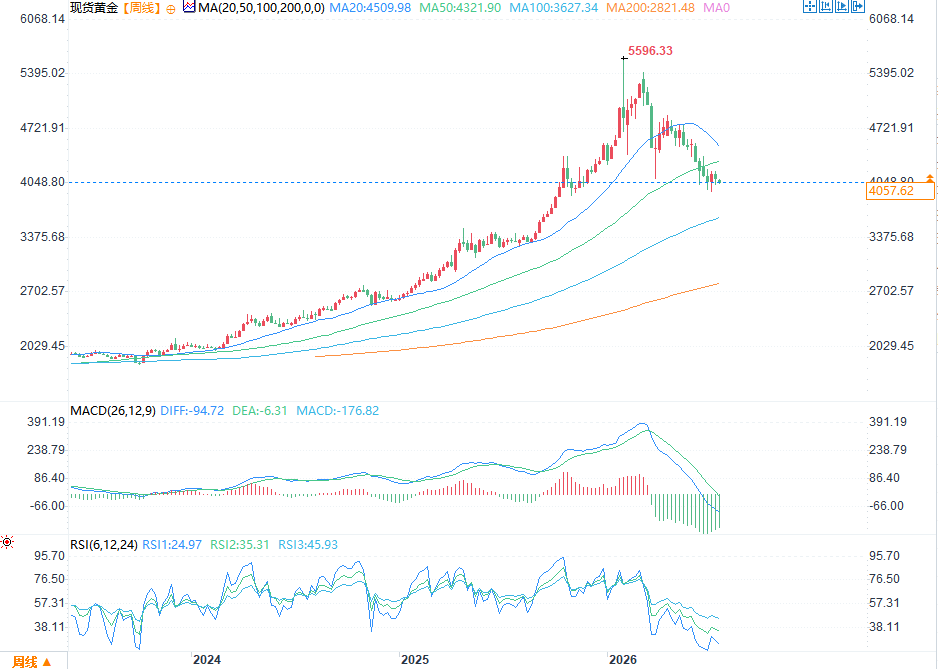 (Spot gold weekly chart source: EasyTrade) Some traders are accustomed to using the 52-week moving average to judge trends, which is perfectly acceptable. At the opening of this week, the 52-week moving average was at $4286.02. Currently, the gold price is trading below the moving average, indicating a weak trend. Recently, there have been very few traders actively selling, resulting in insufficient upward momentum for gold; investors are more willing to place buy orders on dips, looking for reasonable entry points at lower levels. The period from the November 2024 low of $2536.85 to the January 2026 high of $5602.23 represents a large trading range. Currently, the gold price is within this retracement range of $4069.54–$3707.82, with the previous low of $3942.10 falling precisely within this range. With the gold price hovering around the 50% retracement level of $4069.54, does this mean investors believe the current gold price presents an investment opportunity? The only confirmation is that the bulls must firmly establish themselves above the 50-day moving average and continue to rise. There's no need to obsess over precisely timing the bottom; leave finding the absolute lowest point to institutional investors with massive capital. Ordinary traders only need to grasp the timing of trend reversals. The strength of interest rate cut expectations is determined by CPI data. The Fed meeting minutes stifled the upward momentum of gold prices; only weak CPI data can reverse the current downward trend; otherwise, another wave of selling will hit. June CPI data will be released Tuesday morning, with economists unanimously predicting inflation well above 2%. That same afternoon, Warsh will testify before the House Financial Services Committee. During the Q&A session, traders will adjust their positions based on the CPI results. Only if the CPI is significantly lower than market expectations will Warsh be unable to downplay the fact that inflation is cooling during the live hearing; if inflation meets or even exceeds expectations, Warsh, with data to back him up, will continue to maintain a hawkish stance. The triple reality of slowing economic growth, persistently high inflation stickiness, and a still strong job market will not prompt the Fed to cut interest rates, thus the logic of gold rising based on interest rate cut expectations for the remainder of July no longer exists. At the same time, disruptions to shipping in the Strait of Hormuz are pushing up oil prices, further exacerbating the risk of inflation. Iran's blockade of the Strait of Hormuz means that as long as shipping routes remain restricted, every $1 increase in oil prices will raise future inflation expectations, rendering last month's CPI data meaningless. Escalating tensions in the Middle East have brought safe-haven funds, but instead of flowing into gold, they have flowed into the US dollar and US 10-year Treasury bonds. Geopolitical conflicts should ideally boost safe-haven buying of gold, but instead, they are benefiting the dollar and US Treasury bonds, which are suppressing gold prices. This demonstrates that current expectations of interest rate cuts are completely dominating the gold market. Key points to watch : The outcome of this week's gold market hinges on Tuesday afternoon. The CPI data will be released Tuesday morning, and Warsh will testify that afternoon. If the inflation data falls short of expectations, and Warsh's tone becomes dovish during the Q&A session, expectations of interest rate cuts will quickly return, as the market has already priced in the worst-case scenario of higher inflation. However, if the CPI meets or exceeds expectations, Warsh will not back down, and gold will lose the support of interest rate cuts for the remainder of July. Oil prices are an unpredictable variable. The ongoing tensions in the Strait of Hormuz continue to push up long-term energy costs. Regardless of CPI data, higher oil prices are detrimental to gold. Even if Tuesday's inflation data is weak, if oil prices rise by another $5 on Wednesday, higher inflation is almost certain, significantly diminishing the positive effect of the current weak CPI. Long-term investors are looking for value bottoms, while short-term traders are waiting for a trend reversal. $4069.54 (the 50% retracement level of the trading range) is the first key support level. Gold prices are currently testing this level after rebounding from $3942.10; if this support holds, the upward momentum is likely to strengthen after gold prices break through the 52-week moving average. Conversely, if it falls below $3942.10, gold prices will face a new round of downward pressure.
Last week, spot gold closed at $4120.67 per ounce, down $55.02, or 1.32%. Spot Gold Weekly Technical Analysis Last week, spot gold closed at $4120.67, down $55.02, or 1.32%. Just a week ago, gold prices formed a closing reversal low at $3942.10, but contrarian traders who tried to buy at the bottom did not profit. Last week's weak closing performance suggests that short sellers are likely to enter the market this week. Based on the weekly chart, the overall trend remains downward; the recent high is at $4891.54. Only a break above this level will reverse the overall trend upward. Currently, this price level is too high for a breakout, making it highly unlikely. Therefore, I am waiting for gold prices to form a tight W pattern at a lower level, which will provide a better buying opportunity. Once gold prices fall below $3942.10, this potential bullish reversal pattern will be invalidated, and the downtrend will resume. (Spot gold weekly chart source: EasyTrade) Some traders are accustomed to using the 52-week moving average to judge trends, which is perfectly acceptable. At the opening of this week, the 52-week moving average was at $4286.02. Currently, the gold price is trading below the moving average, indicating a weak trend. Recently, there have been very few traders actively selling, resulting in insufficient upward momentum for gold; investors are more willing to place buy orders on dips, looking for reasonable entry points at lower levels. The period from the November 2024 low of $2536.85 to the January 2026 high of $5602.23 represents a large trading range. Currently, the gold price is within this retracement range of $4069.54–$3707.82, with the previous low of $3942.10 falling precisely within this range. With the gold price hovering around the 50% retracement level of $4069.54, does this mean investors believe the current gold price presents an investment opportunity? The only confirmation is that the bulls must firmly establish themselves above the 50-day moving average and continue to rise. There's no need to obsess over precisely timing the bottom; leave finding the absolute lowest point to institutional investors with massive capital. Ordinary traders only need to grasp the timing of trend reversals. The strength of interest rate cut expectations is determined by CPI data. The Fed meeting minutes stifled the upward momentum of gold prices; only weak CPI data can reverse the current downward trend; otherwise, another wave of selling will hit. June CPI data will be released Tuesday morning, with economists unanimously predicting inflation well above 2%. That same afternoon, Warsh will testify before the House Financial Services Committee. During the Q&A session, traders will adjust their positions based on the CPI results. Only if the CPI is significantly lower than market expectations will Warsh be unable to downplay the fact that inflation is cooling during the live hearing; if inflation meets or even exceeds expectations, Warsh, with data to back him up, will continue to maintain a hawkish stance. The triple reality of slowing economic growth, persistently high inflation stickiness, and a still strong job market will not prompt the Fed to cut interest rates, thus the logic of gold rising based on interest rate cut expectations for the remainder of July no longer exists. At the same time, disruptions to shipping in the Strait of Hormuz are pushing up oil prices, further exacerbating the risk of inflation. Iran's blockade of the Strait of Hormuz means that as long as shipping routes remain restricted, every $1 increase in oil prices will raise future inflation expectations, rendering last month's CPI data meaningless. Escalating tensions in the Middle East have brought safe-haven funds, but instead of flowing into gold, they have flowed into the US dollar and US 10-year Treasury bonds. Geopolitical conflicts should ideally boost safe-haven buying of gold, but instead, they are benefiting the dollar and US Treasury bonds, which are suppressing gold prices. This demonstrates that current expectations of interest rate cuts are completely dominating the gold market. Key points to watch : The outcome of this week's gold market hinges on Tuesday afternoon. The CPI data will be released Tuesday morning, and Warsh will testify that afternoon. If the inflation data falls short of expectations, and Warsh's tone becomes dovish during the Q&A session, expectations of interest rate cuts will quickly return, as the market has already priced in the worst-case scenario of higher inflation. However, if the CPI meets or exceeds expectations, Warsh will not back down, and gold will lose the support of interest rate cuts for the remainder of July. Oil prices are an unpredictable variable. The ongoing tensions in the Strait of Hormuz continue to push up long-term energy costs. Regardless of CPI data, higher oil prices are detrimental to gold. Even if Tuesday's inflation data is weak, if oil prices rise by another $5 on Wednesday, higher inflation is almost certain, significantly diminishing the positive effect of the current weak CPI. Long-term investors are looking for value bottoms, while short-term traders are waiting for a trend reversal. $4069.54 (the 50% retracement level of the trading range) is the first key support level. Gold prices are currently testing this level after rebounding from $3942.10; if this support holds, the upward momentum is likely to strengthen after gold prices break through the 52-week moving average. Conversely, if it falls below $3942.10, gold prices will face a new round of downward pressure.
- Risk Warning and Disclaimer
- The market involves risk, and trading may not be suitable for all investors. This article is for reference only and does not constitute personal investment advice, nor does it take into account certain users’ specific investment objectives, financial situation, or other needs. Any investment decisions made based on this information are at your own risk.