Approaching the previous high of 101.80: Which set of data are dollar bulls most worried about?
2026-07-13 20:32:13
On Monday, July 13th, the US dollar index was fluctuating around 100.9, with the market yet to establish a one-way pricing strategy. The ongoing conflict in the Gulf region continues to disrupt energy prices and inflation risk premiums; however, safe-haven buying of the dollar is unstable, and the interest rate path remains the dominant variable. The current focus has shifted to the cross-validation between inflation stickiness, short-term interest rate repricing, and Federal Reserve Chairman Kevin Warsh's congressional testimony. The US June Consumer Price Index will be released on July 14th, while the Producer Price Index and retail sales will be released on July 15th and 16th, respectively. This flurry of data will directly test whether the market's pricing in policy tightening this year is excessive. 
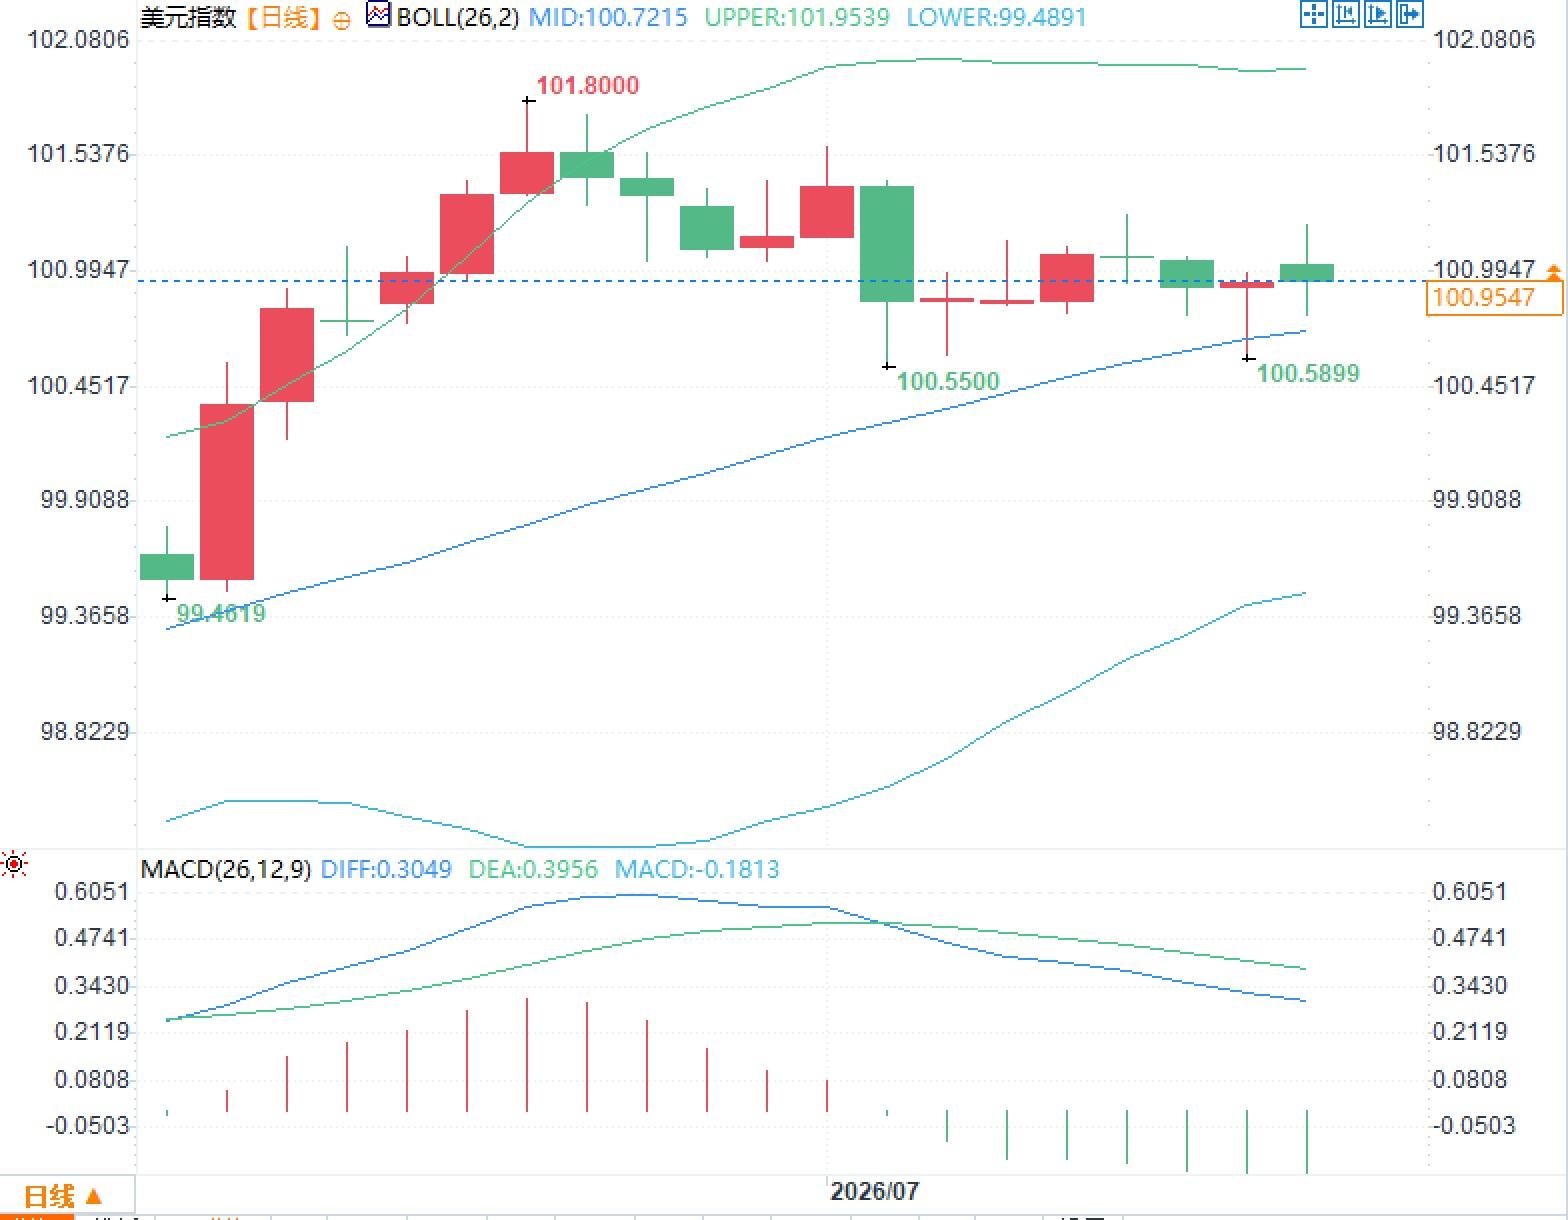 However, the MACD indicator shows the DIFF line at 0.3049, lower than the DEA line at 0.3956, and the histogram at -0.1813, indicating that while the price trend remains intact, marginal momentum has clearly cooled. 101.80 is the previous high resistance level; below, 100.72, 100.55, and 99.49 correspond to the Bollinger Band middle line, the recent low, and the Bollinger Band lower line, respectively. Currently, the truly significant information is not the immediate price movement after the data release, but whether the trading range can expand and whether the closing price can break out of the 100.55 to 101.80 consolidation range.
The 100-point mark is not a confirmation of direction, but rather a concentrated area of policy premium.
After the US dollar index climbed back above 100, the core driver was not the growth narrative, but rather the renewed widening of interest rate differentials. The Federal Reserve maintained the target range for the federal funds rate at 3.50%-3.75% in June, and its latest economic projections place a median interest rate of 3.8% by the end of 2026, higher than the current midpoint of 3.625%, indicating that policymakers have reserved room for further tightening. The interest rate futures curve currently points to a level close to 4% by year-end, meaning that at least one 25-basis-point increase has already been partially priced in, and a significant probability of further tightening over the next 12 months remains. This explains why the US dollar index has been able to hold near 100 despite fluctuating risk sentiment. The real support is not its absolute safe-haven attribute, but rather the cash interest rate differential and expectations of real interest rates. As long as short-term yields do not decline significantly, a dollar pullback is more likely to manifest as consolidation at higher levels rather than a trend reversal.The key to inflation data is not the overall decline, but the quality of the cooling.
The US Consumer Price Index (CPI) rose 0.5% month-over-month and 4.2% year-over-year in May, with energy prices rising 3.9% month-over-month, contributing over 60% of the total increase. The core index rose 0.2% month-over-month and 2.9% year-over-year. The mainstream market expectation for June is a month-over-month decline of approximately 0.1% in the overall index and a month-over-month increase of approximately 0.2% in the core index. On the surface, aggregate inflation may have clearly declined, but if the cooling is mainly due to a pullback in gasoline prices, while housing, healthcare, and other service prices remain resilient, the policy implications will still lean towards the view that the inflation structure has not fully improved. Pressure on the production side cannot be ignored either. The final demand producer price index (PPI) rose 1.1% month-over-month and 6.5% year-over-year in May, while the broad core PPI, excluding food, energy, and trade services, rose 0.8% month-over-month and 5.1% year-over-year. Rising energy and transportation costs indicate that upstream pressure has not yet fully transmitted to the consumer side. If producer prices remain strong in June, the market will find it more difficult to resume pricing in interest rate cuts, and the interest rate differential support for the US dollar index will be more stable.Stabilizing employment and resilient consumption will determine whether the US dollar can break through its previous high.
June nonfarm payrolls increased by only 57,000, the unemployment rate remained at 4.2%, and the labor force participation rate fell to 61.5%, indicating a weak job market, but not a sharp slowdown either. Average hourly earnings rose 0.3% month-on-month and 3.5% year-on-year, with wage growth still above the comfortable range implied by the 2% inflation target. For the foreign exchange market, this combination of slowing employment but relatively strong wages makes it easier to maintain expectations of a tighter policy than simply strong employment. Retail sales rose 0.9% month-on-month in May, reaching a total of $763.7 billion; sales in the controlled group rose 0.7%, indicating that basic consumption remains resilient after excluding volatile items such as automobiles and gasoline. In June, the market expects total retail sales growth to slow to 0.3%, with the controlled group growing at around 0.5%. If the controlled group continues to maintain positive growth, consumption will provide a buffer for nominal growth; only if it is significantly weaker than expected will the market systematically lower its pricing for a year-end rate hike. Warsh recently emphasized that the Fed has the capability and will deliver on its 2% price stability target. If their congressional testimony continues to emphasize inflation risks, energy shocks, and expectations management, short-term interest rates may react before the dollar index, and then amplify exchange rate volatility through the interest rate differential.The technical structure was not damaged, but the kinetic energy has entered the decay phase.
The daily chart shows that the US dollar index rebounded from 99.4619 to 101.8000, and is currently around 100.95, still above the Bollinger Middle Band at 100.7215, not far from the Upper Band at 101.9539. The area between 100.55 and 100.59 forms a dense area of recent pullback lows, while the vicinity of 100.72 is where the Middle Band coincides with short-term market costs. As the index remains above the Middle Band, the structure remains in a high-level consolidation phase after an upward move. However, the MACD indicator shows the DIFF line at 0.3049, lower than the DEA line at 0.3956, and the histogram at -0.1813, indicating that while the price trend remains intact, marginal momentum has clearly cooled. 101.80 is the previous high resistance level; below, 100.72, 100.55, and 99.49 correspond to the Bollinger Band middle line, the recent low, and the Bollinger Band lower line, respectively. Currently, the truly significant information is not the immediate price movement after the data release, but whether the trading range can expand and whether the closing price can break out of the 100.55 to 101.80 consolidation range.
- Risk Warning and Disclaimer
- The market involves risk, and trading may not be suitable for all investors. This article is for reference only and does not constitute personal investment advice, nor does it take into account certain users’ specific investment objectives, financial situation, or other needs. Any investment decisions made based on this information are at your own risk.