The US dollar index faces resistance at 101.80 and support at the 100.78 mid-range level: awaiting decisive data.
2026-07-14 15:58:11
On Tuesday, July 14th, the US dollar index was trading around 101.2. The market is awaiting the release of US June consumer price data at 8:30 PM today. Meanwhile, the yield on the 10-year US Treasury note is approximately 4.62%, and the yield on the 2-year note is approximately 4.28%. The renewed rise in short-term interest rates indicates that current foreign exchange pricing is not simply facing a "decline in inflation," but rather a complex combination of core service stickiness and a reassessment of policy expectations.
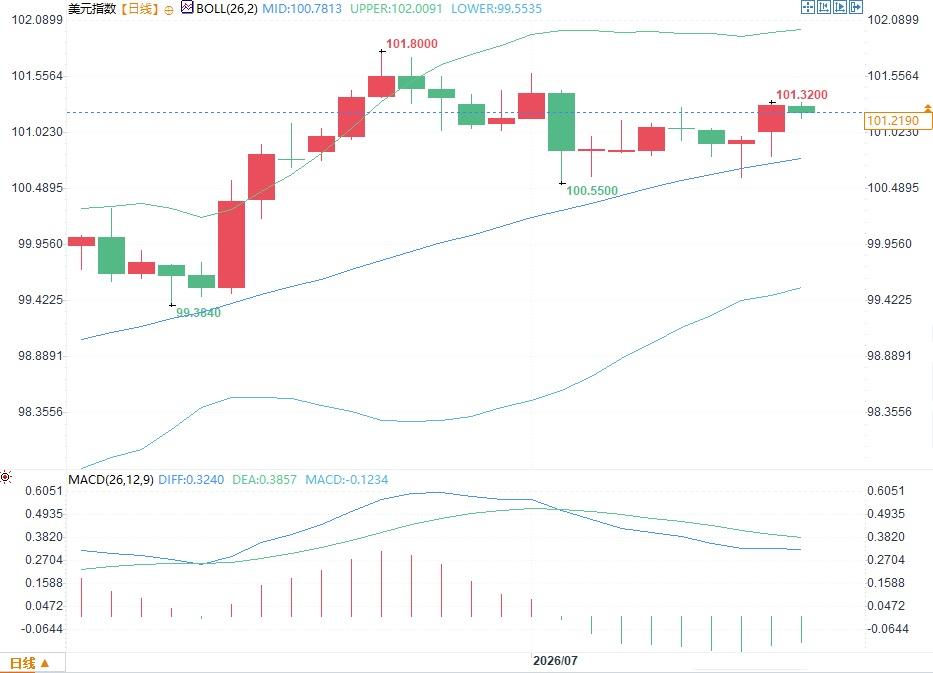 It's worth noting that the MACD's DIFF is 0.3240, DEA is 0.3857, and the histogram is -0.1234, indicating that prices are still relatively high, but upward momentum has weakened. The current chart pattern doesn't show a clear reversal, but rather a continuation of the trend coupled with weakening momentum. If June inflation is only dragged down by energy prices, the index may continue to digest within the 100.78 to 102.01 range; only if core inflation and short-term yields move in the same direction will this range be more likely to be broken effectively.
Inflation may decline in June, but data quality is more important than the surface figures.
Current forecasts are not entirely consistent, with annual overall inflation expectations concentrated between 3.8% and 3.9%, lower than May's 4.2%; monthly overall prices are expected to decline by 0.2% to 0.1%. The Cleveland Fed's immediate forecast updated on July 13 was -0.06% monthly and 3.92% annually, with core monthly at 0.23% and 2.85% annually. In other words, the market's real focus is not on whether overall inflation will turn negative, but on whether core indicators excluding food and energy will slow down in tandem. This round of overall inflation decline has been mainly driven by a sharp drop in gasoline prices, with the energy component likely contributing the vast majority of the decline. The problem is that the recent rebound in crude oil prices suggests that the low energy prices in June are more of a temporary window than a sustainable trend. If overall inflation is lower than expected, but core inflation remains around 0.2%, the market may quickly weaken its interpretation of a "comprehensive cooling" and reassess the transmission of the July energy rebound to subsequent data.Core services will determine whether the US dollar index can hold the 101 level.
Federal Reserve Governor Waller stated on July 13 that core services account for approximately 75% of core prices, with nearly 70% of these categories showing three-month and twelve-month inflation rates above 3%. This structural data indicates that prices for accommodation, rent, insurance, healthcare, and other services remain central to policy decisions. World Cup-related accommodation demand and a rebound in motor vehicle insurance prices may also contribute to a continued firming of core services in June. Therefore, the dollar index's reaction to the data may exhibit a clear stratification. If overall inflation declines but core indicators meet expectations, short-term yields may not fall significantly, potentially limiting the downside for the dollar index. Only if the monthly increase in core inflation is below 0.2%, and service sub-sectors cool simultaneously, will expectations of interest rate hikes likely subside. Conversely, if the monthly core inflation reaches 0.3% or higher, the market will likely view the decline in energy prices as short-term noise, reinforcing pricing in a prolonged period of high interest rates or even further tightening. Following the June meeting, the Federal Reserve maintained its target range for the federal funds rate at 3.50% to 3.75%, with the next policy meeting scheduled for July 28-29. The current 2-year yield has risen to around 4.28%, higher than the upper limit of the policy range, reflecting that the market is beginning to price in a risk premium for further tightening. For the US dollar index, this renewed widening of short-term interest rate differentials has a more lasting impact than a single overall inflation figure. Position aggregation shows that net long positions in the US dollar have reached nearly $39.8 billion, a level that is approximately 10 years high, and this crowding could amplify two-way volatility after data releases.Technical analysis suggests the trend remains intact, but momentum has cooled.
The daily chart shows the US dollar index currently at around 101.2, still above the Bollinger Band middle line at 100.7813, indicating that the medium-term structure has not yet weakened. The upper Bollinger Band is at 102.0091, and the recent high of 101.8000 forms a dense resistance zone above. On the downside, the first support level to watch is around 101, followed by the middle Bollinger Band at 100.78 and the recent low of 100.55. It's worth noting that the MACD's DIFF is 0.3240, DEA is 0.3857, and the histogram is -0.1234, indicating that prices are still relatively high, but upward momentum has weakened. The current chart pattern doesn't show a clear reversal, but rather a continuation of the trend coupled with weakening momentum. If June inflation is only dragged down by energy prices, the index may continue to digest within the 100.78 to 102.01 range; only if core inflation and short-term yields move in the same direction will this range be more likely to be broken effectively.
- Risk Warning and Disclaimer
- The market involves risk, and trading may not be suitable for all investors. This article is for reference only and does not constitute personal investment advice, nor does it take into account certain users’ specific investment objectives, financial situation, or other needs. Any investment decisions made based on this information are at your own risk.