Gold prices stabilized above $4,000 after PPI fell and US Treasury yields rose.
2026-07-15 22:00:11
On Wednesday (July 15) during the US trading session, spot gold rose slightly while spot silver weakened. Cooling US inflation data generally benefited precious metals, but renewed tensions in the Strait of Hormuz pushed up oil prices and US Treasury yields. Spot gold traded around $4061.70 per ounce, up 0.25%; spot silver was quoted at $58.14, down 0.74% on the day.  Gold traded in a range of $4016.60-$4066.90 in early trading, holding above the $4000 mark but failing to break through the $4090-$4140 resistance zone defined by the latest technical pattern. Silver traded in a range of $57.68-$59.20 in early trading, holding above the $57.15 support level but failing to hold above $59. Following the release of the Consumer Price Index (CPI) and Producer Price Index (PPI), the market bet on a slower pace of interest rate hikes by the Federal Reserve; however, rising oil prices and higher US Treasury yields limited further gains in gold prices. The overall CPI in June fell 0.4% month-on-month and slowed to 3.5% year-on-year; the core CPI remained flat month-on-month and fell to 2.6% year-on-year. The PPI data released that day further confirmed the cooling of inflation: final demand prices fell 0.3% month-on-month in June, commodity prices declined 1.4%, and service prices rose 0.2%; the year-on-year growth rate of PPI fell to 5.5%; core wholesale prices rose 0.2% month-on-month and 4.7% year-on-year. This data weakened the necessity for the Federal Reserve to raise interest rates in July. However, the 10-year US Treasury yield remained around 4.60%, and the US dollar index remained stable at 100.97. Traders were cautious, seeing inflation decline while worrying about a rebound in energy prices. The current situation in the Strait of Hormuz can be summarized as follows: shipping is barely passable, but the situation is highly tense, shipping faces military risks, and has long since deviated from normal operation. After Iran attacked passing ships, the United States restarted its maritime blockade against Iran and intensified its strikes; Iran, in turn, issued a strong statement that if US pressure intensifies, Iran will stop regional energy exports. Brent crude oil prices were around $85.78 per barrel, and West Texas Intermediate (WTI) crude oil prices were around $80.19 per barrel. Even with weaker CPI and PPI data, the risk of energy-driven inflation remains. For gold, the current market presents both advantages and disadvantages: geopolitical tensions are boosting safe-haven buying, but rising oil prices and higher US Treasury yields are limiting upside potential. Looking at the overall market: oil is strong, bonds are under pressure, the dollar is consolidating, and silver is underperforming gold. Traders will focus on three key events: the market's subsequent expectations for Fed interest rates after the PPI data release, Fed official Kevin Warsh's testimony before the Senate, and whether shipping through the Strait of Hormuz will be disrupted again. If US Treasury yields continue to decline, gold will have sufficient momentum to test $4090 and $4140; if oil prices surge again, the market will reassess whether energy inflation will offset the positive impact of the June CPI and PPI declines. Global commodity market: WTI crude oil on the New York Mercantile Exchange strengthened, priced at approximately $80.19 per barrel, while Brent crude oil was around $85.78 per barrel; the US dollar index remained around 100.97; the benchmark 10-year US Treasury yield was approximately 4.60%. Gold technical analysis.
 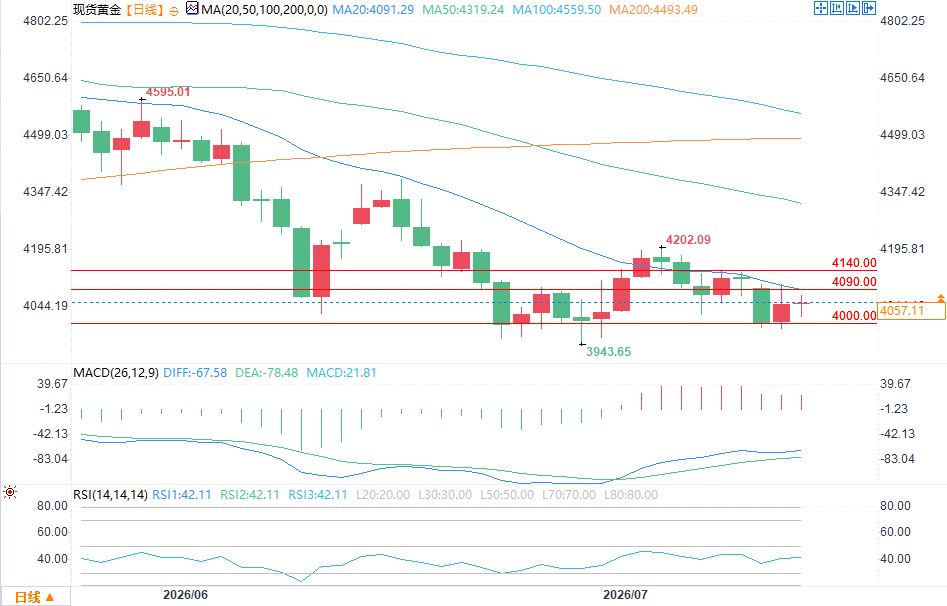 (Spot Gold Daily Chart Source: FX678) Spot gold is dominated by short-term bears: the price is below the 100-period moving average (around $4077) and is generally in a downward channel. Bullish targets: After stabilizing above $4090, the next target is $4140, with an ultimate target of $4200. Bearish targets: A break below $4000 would target $3962 and then $3950. First resistance: $4077, followed by $4090; First support: $4040, followed by $4000. Silver Technical Analysis : Spot silver is also dominated by short-term bears: the price is below the 50-period moving average ($58.81) and the 100-period moving average ($59.36). Bullish targets: After stabilizing above $59.36, the next target is $60.41, with a higher target of $64. Short-selling target: A break below $57.15 support, followed by a drop to $55, and in extreme cases, $50. First resistance: $58.81, then $59.36; First support: $57.15, then $55.
Gold traded in a range of $4016.60-$4066.90 in early trading, holding above the $4000 mark but failing to break through the $4090-$4140 resistance zone defined by the latest technical pattern. Silver traded in a range of $57.68-$59.20 in early trading, holding above the $57.15 support level but failing to hold above $59. Following the release of the Consumer Price Index (CPI) and Producer Price Index (PPI), the market bet on a slower pace of interest rate hikes by the Federal Reserve; however, rising oil prices and higher US Treasury yields limited further gains in gold prices. The overall CPI in June fell 0.4% month-on-month and slowed to 3.5% year-on-year; the core CPI remained flat month-on-month and fell to 2.6% year-on-year. The PPI data released that day further confirmed the cooling of inflation: final demand prices fell 0.3% month-on-month in June, commodity prices declined 1.4%, and service prices rose 0.2%; the year-on-year growth rate of PPI fell to 5.5%; core wholesale prices rose 0.2% month-on-month and 4.7% year-on-year. This data weakened the necessity for the Federal Reserve to raise interest rates in July. However, the 10-year US Treasury yield remained around 4.60%, and the US dollar index remained stable at 100.97. Traders were cautious, seeing inflation decline while worrying about a rebound in energy prices. The current situation in the Strait of Hormuz can be summarized as follows: shipping is barely passable, but the situation is highly tense, shipping faces military risks, and has long since deviated from normal operation. After Iran attacked passing ships, the United States restarted its maritime blockade against Iran and intensified its strikes; Iran, in turn, issued a strong statement that if US pressure intensifies, Iran will stop regional energy exports. Brent crude oil prices were around $85.78 per barrel, and West Texas Intermediate (WTI) crude oil prices were around $80.19 per barrel. Even with weaker CPI and PPI data, the risk of energy-driven inflation remains. For gold, the current market presents both advantages and disadvantages: geopolitical tensions are boosting safe-haven buying, but rising oil prices and higher US Treasury yields are limiting upside potential. Looking at the overall market: oil is strong, bonds are under pressure, the dollar is consolidating, and silver is underperforming gold. Traders will focus on three key events: the market's subsequent expectations for Fed interest rates after the PPI data release, Fed official Kevin Warsh's testimony before the Senate, and whether shipping through the Strait of Hormuz will be disrupted again. If US Treasury yields continue to decline, gold will have sufficient momentum to test $4090 and $4140; if oil prices surge again, the market will reassess whether energy inflation will offset the positive impact of the June CPI and PPI declines. Global commodity market: WTI crude oil on the New York Mercantile Exchange strengthened, priced at approximately $80.19 per barrel, while Brent crude oil was around $85.78 per barrel; the US dollar index remained around 100.97; the benchmark 10-year US Treasury yield was approximately 4.60%. Gold technical analysis. (Spot Gold Daily Chart Source: FX678) Spot gold is dominated by short-term bears: the price is below the 100-period moving average (around $4077) and is generally in a downward channel. Bullish targets: After stabilizing above $4090, the next target is $4140, with an ultimate target of $4200. Bearish targets: A break below $4000 would target $3962 and then $3950. First resistance: $4077, followed by $4090; First support: $4040, followed by $4000. Silver Technical Analysis : Spot silver is also dominated by short-term bears: the price is below the 50-period moving average ($58.81) and the 100-period moving average ($59.36). Bullish targets: After stabilizing above $59.36, the next target is $60.41, with a higher target of $64. Short-selling target: A break below $57.15 support, followed by a drop to $55, and in extreme cases, $50. First resistance: $58.81, then $59.36; First support: $57.15, then $55.
- Risk Warning and Disclaimer
- The market involves risk, and trading may not be suitable for all investors. This article is for reference only and does not constitute personal investment advice, nor does it take into account certain users’ specific investment objectives, financial situation, or other needs. Any investment decisions made based on this information are at your own risk.