Why is gold still stuck below $4,124 despite two inflation data releases showing signs of cooling?
2026-07-15 22:08:11
On Wednesday, July 15th, spot gold recovered its intraday losses after the release of US producer inflation data, rebounding from a low of around $4017 to around $4060, a daily increase of approximately 0.20%. The US dollar and US Treasury yields fell after the data release, easing the holding cost pressures on non-interest-bearing assets. The US final demand producer price index (PPI) fell 0.3% month-on-month in June, compared to a 0.6% increase in the previous month, with the year-on-year increase slowing to 5.5%. This month-on-month decline was mainly due to a 1.4% drop in commodity prices, with energy prices falling 6.4% and gasoline prices falling 12.0%; service prices still rose 0.2% month-on-month. Excluding food, energy, and trade services, the PPI rose 0.1% month-on-month and 5.1% year-on-year. This structure suggests that upstream price pressures have indeed eased, but the cooling is highly dependent on energy projects and is insufficient to prove that widespread inflation has disappeared. 
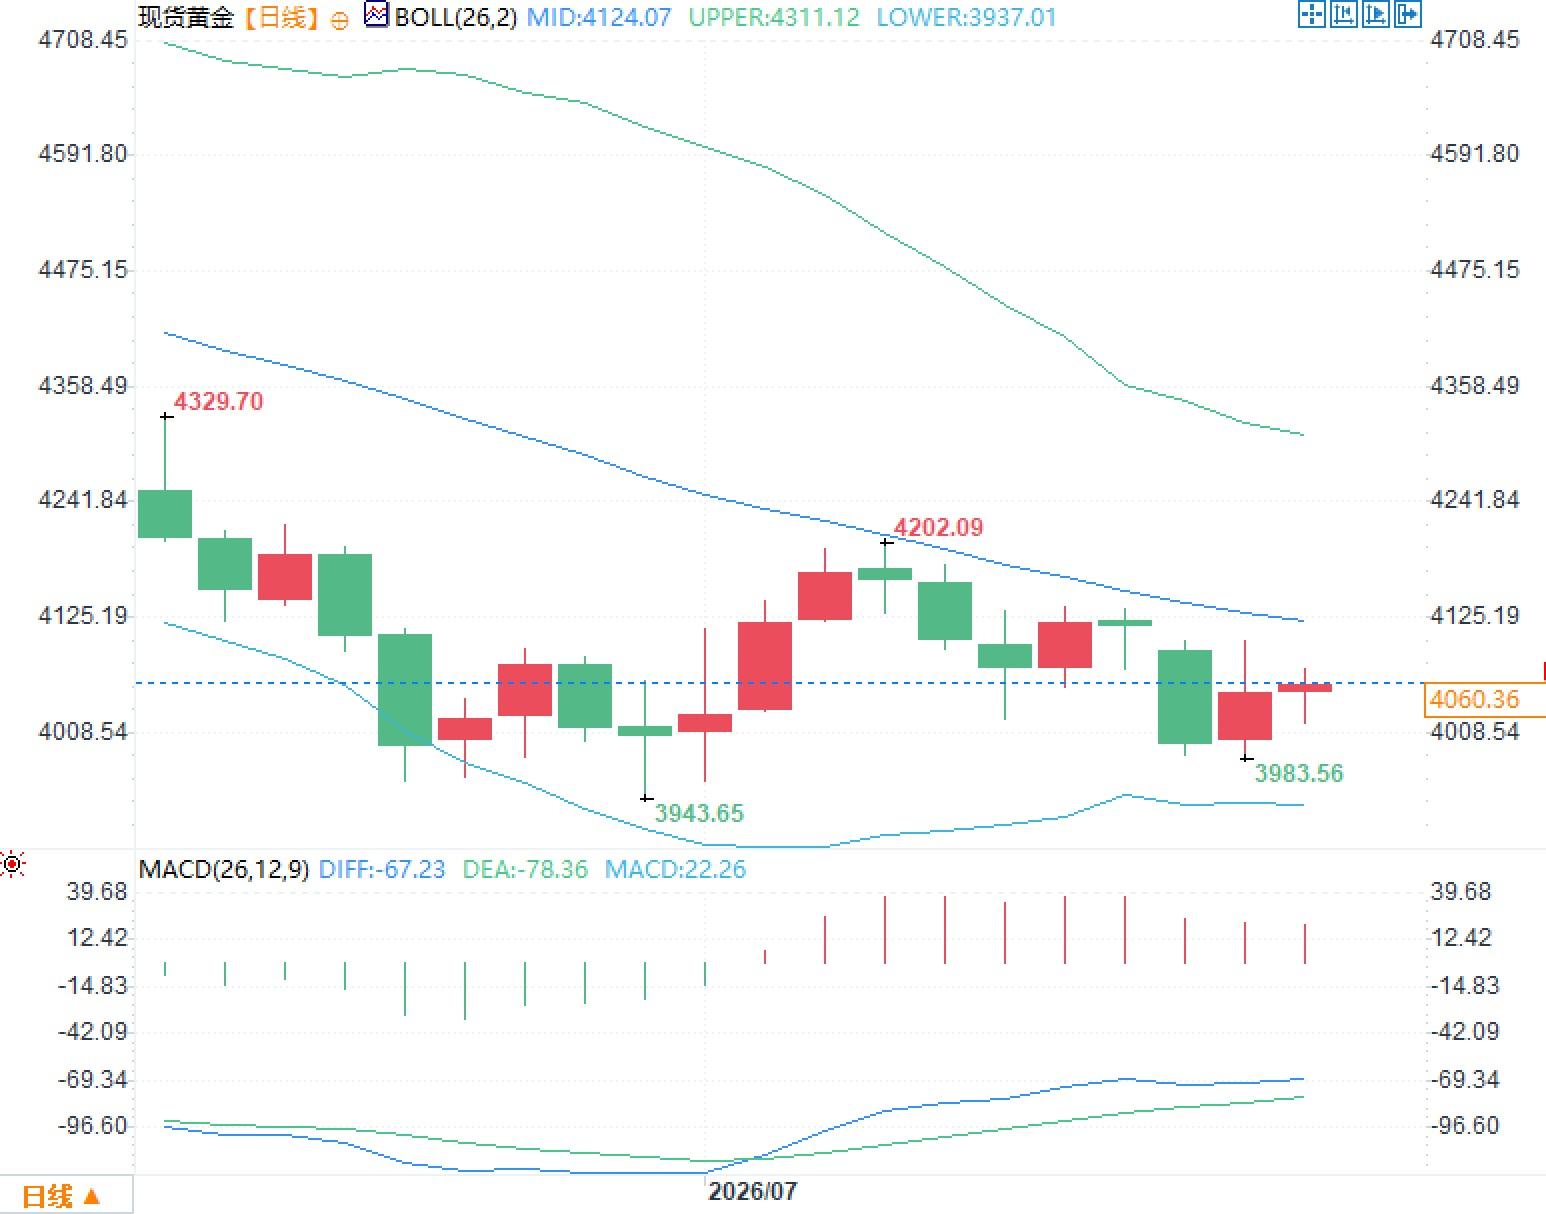 The MACD fast line is around -67.23, the slow line is around -78.36, and the histogram value has rebounded to 22.26. The fast line is above the slow line, indicating that the downward momentum is weakening. However, both lines are still below the zero axis, reflecting that the current situation is more like a correction within a weak trend than a complete trend reversal. The $3937 to $3984 area represents the recent fluctuation boundary, while the $4124 to $4202 area is the key observation zone for whether the rebound can develop into a structural correction.
Why did the cooling of production drive gold prices, but fail to result in a one-sided breakout?
The producer price index (PPI) falling short of expectations primarily altered short-term interest rate pricing. Slower production cost growth means a reduced likelihood of businesses passing on future price increases to end-users, thus weakening market bets on a near-term Fed rate hike. With nominal yields declining, the opportunity cost for gold decreased, allowing prices to quickly recover from pre-data-release losses. However, this data did not signal a comprehensive easing. Energy prices contributed most of the decline in commodity prices, while service prices remained positive, and the year-on-year growth rate of the PPI, excluding volatile items, was still significantly higher than 2%. In other words, the data is more akin to a temporary cooling driven by declining energy prices than a sign of sustained deflation in the production system. For gold, this combination typically helps curb rising yields but is insufficient to completely rule out the possibility of further policy tightening this year. The previous day's US June Consumer Price Index (CPI) fell 0.4% month-on-month, with the year-on-year growth slowing from 4.2% to 3.5%; the core CPI remained flat month-on-month but rose 2.6% year-on-year. Energy prices fell 5.7% month-on-month, gasoline prices fell 9.7%, while housing prices rose 0.1%. The simultaneous cooling of both the consumer and production sides reinforces the judgment that a short-term inflation inflection point has been reached, but both data points show a clear drag from the energy sector.Policy expectations and crude oil risks create a two-way pull.
The Federal Reserve maintained its target range for the federal funds rate at 3.50% to 3.75% at its June meeting. In his congressional testimony on July 14, Fed Chairman Kevin Warsh stated that policymakers have "no room for tolerance" for persistently high inflation and emphasized that restoring price stability remains a policy priority. This means that a single month's decline in inflation will not automatically translate into an easing cycle; policy decisions still depend on whether energy, wage, and service prices cool down in tandem. Gold currently faces a contradiction: cooling inflation data is lowering real interest rate expectations, but the Middle East conflict is pushing up oil risk premiums again. If energy prices continue to rise, the decline in energy prices in the June consumer price index and producer price index could quickly reverse, and the market will reassess the inflation path. At that time, gold may simultaneously attract safe-haven demand and face pressure from a rebound in yields. This mechanism explains why gold was able to rebound quickly from $4017 but lacked sustained expansion above $4060. Safe-haven appeal supports prices, but high oil prices may prolong the duration of restrictive policies, weakening the valuation of non-interest-bearing assets. Gold is currently being traded not based on a single safe-haven logic, but rather on the dynamic net effect of conflict risk, energy inflation, and monetary policy.Technical Structure: The rebound is recovering momentum, but trend resistance has not yet been relieved.
The daily chart shows that the latest spot gold price is around $4060, still below the Bollinger Band middle line at $4124. The upper Bollinger Band is around $4311, and the lower Bollinger Band is around $3937. The continued downward trend of the middle line indicates that the medium-term price center of gravity is still shifting downward; the simultaneous decline of the upper and middle lines also reflects that the previous high-volatility upward structure has turned into a contraction and consolidation. The MACD fast line is around -67.23, the slow line is around -78.36, and the histogram value has rebounded to 22.26. The fast line is above the slow line, indicating that the downward momentum is weakening. However, both lines are still below the zero axis, reflecting that the current situation is more like a correction within a weak trend than a complete trend reversal. The $3937 to $3984 area represents the recent fluctuation boundary, while the $4124 to $4202 area is the key observation zone for whether the rebound can develop into a structural correction.
- Risk Warning and Disclaimer
- The market involves risk, and trading may not be suitable for all investors. This article is for reference only and does not constitute personal investment advice, nor does it take into account certain users’ specific investment objectives, financial situation, or other needs. Any investment decisions made based on this information are at your own risk.