Silver is attempting a breakout from its trading range, with technical patterns suggesting a potential shift in market momentum.
2026-07-21 19:34:15
On Tuesday (July 21), spot silver (XAG/USD) saw increased volatility, with bullish momentum emerging. The recent trading range was between $58.96 and $59.12 per troy ounce. Market data shows that compared to Monday's price range of around $56.40 to $56.92, silver's intraday gain was approximately 3.86% to 4.54%.  Silver possesses the dual attributes of both an industrial commodity and a traditional safe-haven asset. In recent weeks, influenced by a confluence of factors including shifts in central bank policy expectations and a persistent supply gap, silver prices have continued to fluctuate within a wide range. However, today's market movement indicates that silver is attempting an upward breakout, the success or failure of which may determine the short-term market direction. Technical Analysis: Focus on the Triangle Pattern and Market Volume Profile From the 4-hour chart, silver is forming a triangle consolidation pattern: a descending trendline connects a series of secondary highs since the $63.00 high; another ascending trendline connects the gradually rising lows that began around $56. The two trendlines are gradually converging, and their intersection corresponds precisely to the high-volume area in the volume profile. After a previous upward test, silver prices retraced to the lower edge of the volume profile at $56.643. If the bulls fail to recover the upper space, this level may turn from support into resistance.
 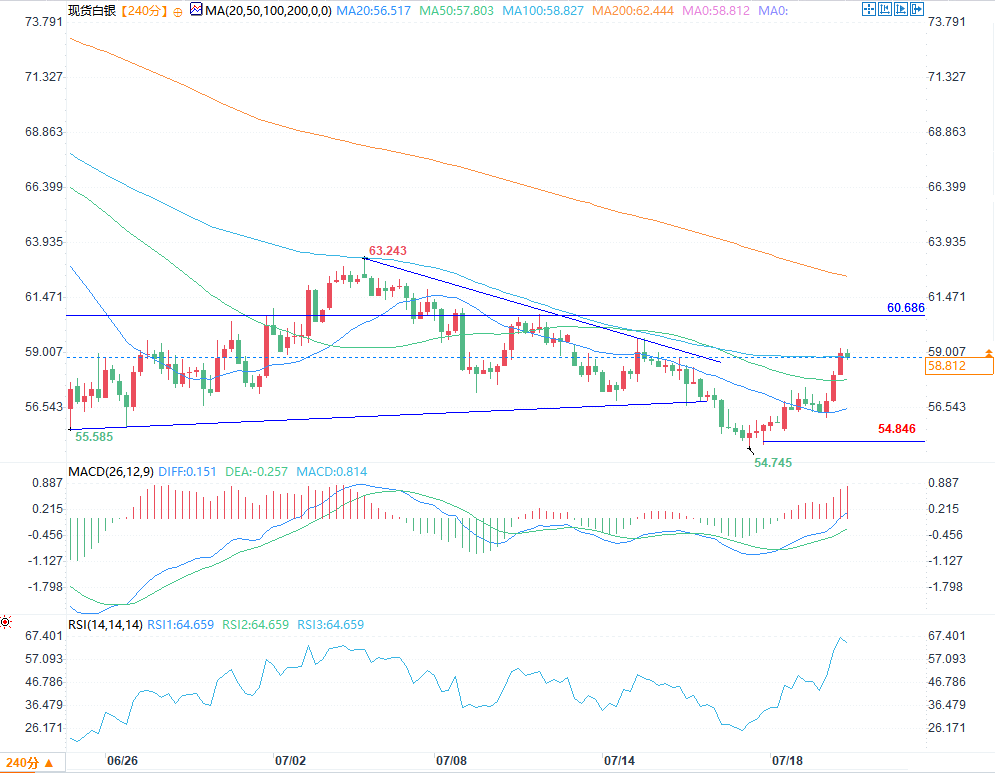 (Spot silver 4-hour chart source: EasyTrade) If the price retraces, the key support level is at $54.846. On the upside, if it successfully breaks out of the current trading range, the price targets are successively the Point of Control (POC) at $58.357, the upper edge of the trading range at $59.895, and the key resistance level at $60.686. Indicators are mixed, but overall lean towards optimism. The Relative Strength Index (RSI) and moving averages are currently in the neutral range (around 40-45); the moving averages remain in a bearish alignment, but the RSI curve has turned upwards, approaching the neutral boundary. Currently, the RSI has not yet formed a clear breakout signal, meaning that upward momentum still needs confirmation. Unlike the typical shrinking volume characteristic of a converging triangle pattern, current silver trading volume has not declined significantly, reflecting continued market activity and undiminished investor participation. Daily chart and futures market data show that silver futures (such as the SIU6 contract) have been steadily advancing towards the $58-$59 range recently, successfully breaking above the short-term downtrend line on multiple trading days. Fundamental drivers: Supply gap, industrial demand, and the macroeconomic environment all converge . Silver price movements are dominated by the interplay between bullish and bearish forces. On the bullish side: The structural supply shortage in silver is expected to continue into 2026; strong investment demand has offset pressure from weakening demand in some specific industrial sectors. Meanwhile, the application of silver in photovoltaics, electronics, new energy vehicles, and artificial intelligence-related infrastructure continues to expand, supporting long-term demand. This round of silver price increases is closely related to the overall strength of the precious metals sector. With the technical breakout (gold breaking out of a triangle pattern, silver breaking above the downtrend line since May), the combined market capitalization of gold and silver surged by hundreds of billions of dollars in a single day. Traders believe that the inflow of safe-haven funds, expectations of interest rate cuts due to cooling inflation, and changes in fund holdings have jointly driven this round of gains. However, several negative factors remain constraining the market: geopolitical conflicts pushing up energy prices could reignite inflation concerns, suppressing the price of non-interest-bearing assets like silver in the short term. Furthermore, the upcoming Federal Reserve meeting on July 28-29, with fluctuating policy expectations, will be a significant catalyst for market movements. If the Fed releases dovish signals, silver is expected to be boosted; conversely, hawkish rhetoric will limit its upside potential. The gold-silver ratio has fallen to 68.92 (from 71.06 previously), indicating that silver has recently outperformed gold, a characteristic often seen during periods of rising risk appetite or recovering industrial demand. Year-to-date, silver prices have fallen approximately 17% from their year-to-date high, but compared to the $38-$39 range projected for mid-2025, current prices remain significantly high. This large price difference reflects the significant volatility caused by frequent changes in the macroeconomic environment. Outlook and Key Price Levels The core of the short-term market trend depends on whether the bulls can hold above the $59-$60 range. If the price breaks through the triangle consolidation range with upward momentum, it could potentially reach $60.686. If the Federal Reserve expresses support for risk assets, silver prices could rise further. Conversely, if the bulls fail to hold the gains, the price may retest the $56.643-$54.85 support zone. Multiple analysts point out that $54.48 is a crucial medium- to long-term support/resistance level. Investors should closely monitor the following: the outcome of the Federal Reserve's July 28-29 interest rate meeting, focusing on interest rate policy and economic outlook guidance; various geopolitical situations affecting oil prices and inflation; industrial demand data from major economies such as China and the United States; and trading volume and RSI indicators to verify the validity of the breakout. Silver's unique dual nature makes it highly sensitive to both macroeconomic monetary policy and real economic demand. Tight supply and growing industrial demand provide a medium- to long-term positive foundation, but short-term trends depend on the technical breakout from the current consolidation range and changes in market expectations regarding central bank policies. Given the current increased market volatility, traders and investors operating near these key price levels must strictly manage risk.
Silver possesses the dual attributes of both an industrial commodity and a traditional safe-haven asset. In recent weeks, influenced by a confluence of factors including shifts in central bank policy expectations and a persistent supply gap, silver prices have continued to fluctuate within a wide range. However, today's market movement indicates that silver is attempting an upward breakout, the success or failure of which may determine the short-term market direction. Technical Analysis: Focus on the Triangle Pattern and Market Volume Profile From the 4-hour chart, silver is forming a triangle consolidation pattern: a descending trendline connects a series of secondary highs since the $63.00 high; another ascending trendline connects the gradually rising lows that began around $56. The two trendlines are gradually converging, and their intersection corresponds precisely to the high-volume area in the volume profile. After a previous upward test, silver prices retraced to the lower edge of the volume profile at $56.643. If the bulls fail to recover the upper space, this level may turn from support into resistance. (Spot silver 4-hour chart source: EasyTrade) If the price retraces, the key support level is at $54.846. On the upside, if it successfully breaks out of the current trading range, the price targets are successively the Point of Control (POC) at $58.357, the upper edge of the trading range at $59.895, and the key resistance level at $60.686. Indicators are mixed, but overall lean towards optimism. The Relative Strength Index (RSI) and moving averages are currently in the neutral range (around 40-45); the moving averages remain in a bearish alignment, but the RSI curve has turned upwards, approaching the neutral boundary. Currently, the RSI has not yet formed a clear breakout signal, meaning that upward momentum still needs confirmation. Unlike the typical shrinking volume characteristic of a converging triangle pattern, current silver trading volume has not declined significantly, reflecting continued market activity and undiminished investor participation. Daily chart and futures market data show that silver futures (such as the SIU6 contract) have been steadily advancing towards the $58-$59 range recently, successfully breaking above the short-term downtrend line on multiple trading days. Fundamental drivers: Supply gap, industrial demand, and the macroeconomic environment all converge . Silver price movements are dominated by the interplay between bullish and bearish forces. On the bullish side: The structural supply shortage in silver is expected to continue into 2026; strong investment demand has offset pressure from weakening demand in some specific industrial sectors. Meanwhile, the application of silver in photovoltaics, electronics, new energy vehicles, and artificial intelligence-related infrastructure continues to expand, supporting long-term demand. This round of silver price increases is closely related to the overall strength of the precious metals sector. With the technical breakout (gold breaking out of a triangle pattern, silver breaking above the downtrend line since May), the combined market capitalization of gold and silver surged by hundreds of billions of dollars in a single day. Traders believe that the inflow of safe-haven funds, expectations of interest rate cuts due to cooling inflation, and changes in fund holdings have jointly driven this round of gains. However, several negative factors remain constraining the market: geopolitical conflicts pushing up energy prices could reignite inflation concerns, suppressing the price of non-interest-bearing assets like silver in the short term. Furthermore, the upcoming Federal Reserve meeting on July 28-29, with fluctuating policy expectations, will be a significant catalyst for market movements. If the Fed releases dovish signals, silver is expected to be boosted; conversely, hawkish rhetoric will limit its upside potential. The gold-silver ratio has fallen to 68.92 (from 71.06 previously), indicating that silver has recently outperformed gold, a characteristic often seen during periods of rising risk appetite or recovering industrial demand. Year-to-date, silver prices have fallen approximately 17% from their year-to-date high, but compared to the $38-$39 range projected for mid-2025, current prices remain significantly high. This large price difference reflects the significant volatility caused by frequent changes in the macroeconomic environment. Outlook and Key Price Levels The core of the short-term market trend depends on whether the bulls can hold above the $59-$60 range. If the price breaks through the triangle consolidation range with upward momentum, it could potentially reach $60.686. If the Federal Reserve expresses support for risk assets, silver prices could rise further. Conversely, if the bulls fail to hold the gains, the price may retest the $56.643-$54.85 support zone. Multiple analysts point out that $54.48 is a crucial medium- to long-term support/resistance level. Investors should closely monitor the following: the outcome of the Federal Reserve's July 28-29 interest rate meeting, focusing on interest rate policy and economic outlook guidance; various geopolitical situations affecting oil prices and inflation; industrial demand data from major economies such as China and the United States; and trading volume and RSI indicators to verify the validity of the breakout. Silver's unique dual nature makes it highly sensitive to both macroeconomic monetary policy and real economic demand. Tight supply and growing industrial demand provide a medium- to long-term positive foundation, but short-term trends depend on the technical breakout from the current consolidation range and changes in market expectations regarding central bank policies. Given the current increased market volatility, traders and investors operating near these key price levels must strictly manage risk.
- Risk Warning and Disclaimer
- The market involves risk, and trading may not be suitable for all investors. This article is for reference only and does not constitute personal investment advice, nor does it take into account certain users’ specific investment objectives, financial situation, or other needs. Any investment decisions made based on this information are at your own risk.