Saudi Arabia's westward export routes are under pressure, and the oil price risk premium has entered its second phase.
2026-07-22 15:44:14
On Wednesday, July 22, the core pricing strategy in the international crude oil market shifted from the single risk of passage through the Strait of Hormuz to a complex scenario involving simultaneous disruptions to both the Strait of Hormuz and the Bab el-Mandeb Strait. Brent crude was currently trading around $94 per barrel. The price breakout occurring simultaneously with deteriorating shipping data suggests that the current rise is not purely driven by short-term sentiment, but rather reflects the market's recalculation of the real constraints imposed by deliverable crude oil, extended shipping distances, and rising insurance costs. 
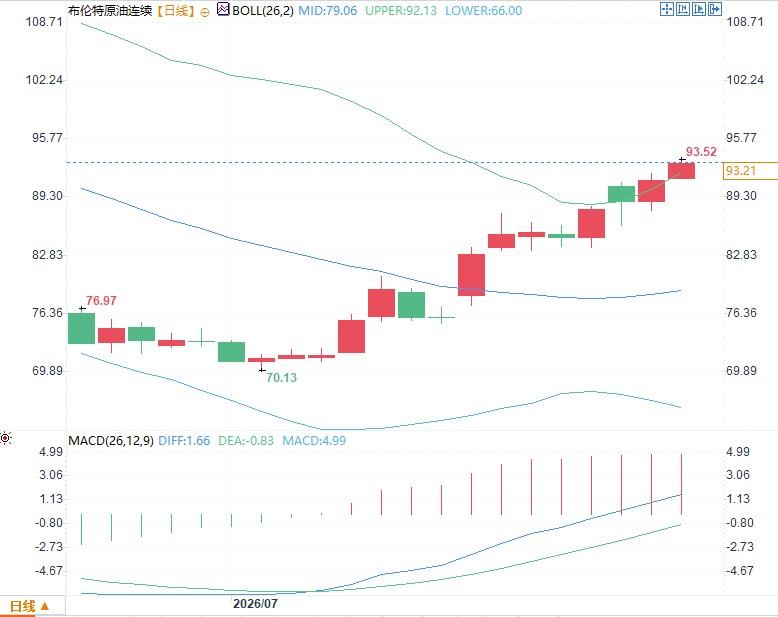 In the MACD indicator, the DIFF is 1.66, the DEA is -0.83, and the histogram has expanded to 4.99. The fast line has crossed above the slow line and continues to rise, indicating that the upward momentum has not yet shown a clear weakening. However, the DEA is still below the zero axis, suggesting that this round of market movement is more likely a rapid recovery from a deep weakness rather than a confirmation of a long-term trend. The closer the price is to the outer edge of the upper Bollinger Band, the more sensitive it is to new news. The most crucial factor at present is not the $93 price level itself, but the extent to which the rise translates from risk expectations into actual supply losses. If tankers only temporarily suspend operations and gradually resume passage, some of the shipping premium in the price may fall back; if shipments from Yanbu continue, but the passage rate in the Bab el-Mandeb Strait declines significantly, the market will further focus on increased floating storage, delivery delays, and tight near-month contracts.
The dual Straits risk is altering the crude oil pricing framework.
On July 21, it was reported that only three cargo ships were observed passing through the Strait of Hormuz, down from four the previous day and marking the lowest daily number since early May. No very large crude carriers (VLCCs) or LNG carriers passed through, and traffic remained nearly at a standstill the following morning. While the Strait of Hormuz is not legally closed, from a commercial shipping perspective, shipowners, charterers, and insurance companies are proactively mitigating risk by reducing traffic. More importantly, the Red Sea originally served as a diversionary route for Gulf exports. Saudi Arabia could transport crude oil from its eastern oil fields to Yanbu via east-west pipelines, and then load it onto ships in the Red Sea, thus reducing its dependence on the Strait of Hormuz. Data shows that in the week ending July 17, crude oil exports from Yanbu's two terminals reached approximately 5.9 million barrels per day. Such a high volume of shipments indicates that the Red Sea is no longer a marginal backup route, but a core buffer in the current supply system. If the risk in the Bab el-Mandeb Strait increases, the alternative routes themselves will lose stability. The market will no longer face the obstruction of a single shipping channel, but rather simultaneous pressure on both the main and backup channels. This correlation risk typically increases oil price volatility and causes far-month prices to lag behind spot and near-month contracts in reflecting near-month supply tightness.The tanker turning around sends a cost signal, not simply a panic.
Abnormal behavior has emerged in Red Sea shipping data. The Gas King, carrying liquefied petroleum gas, initially sailing south, then turned north towards the Suez Canal; the New Explorer, carrying Saudi crude oil and bound for Singapore, nearly stopped in the Red Sea, with its system status indicating a loss of maneuverability; another Aframax tanker, Lahore, also paused its voyage after loading. Some vessels subsequently resumed their original routes, indicating that a unified shutdown has not yet occurred in the waterway, but shipowners are conducting vessel-by-vehicle assessments. For vessels heading to Asia, sailing north from the Red Sea and circumnavigating Africa means a comprehensive increase in voyage distance, fuel consumption, schedule occupancy, and Suez Canal transit fees. Even if cargo is eventually delivered, the extended transit time reduces effective shipping capacity. Tankers haven't disappeared, but the number of trips each ship can complete within the same timeframe has decreased, effectively contracting shipping supply. Therefore, the oil price risk premium should not be interpreted solely as actual production cuts. Whether crude oil arrives at refineries on schedule after leaving the terminal also determines regional spot premiums/discounts and inventory safety margins. As long as shipowners demand higher freight rates and insurance companies increase surcharges, refinery landed costs will change before global production data.The technical structure around $93 reveals three layers of information.
From a daily chart perspective, Brent crude oil has been rising steadily from a low of around $70.13 per barrel, with a cumulative rebound of over 30%. The Bollinger Band middle line is at $79.06 per barrel, and the upper line is at $92.13 per barrel. The price has already moved to the outside of the upper line, indicating strong trend momentum, but the deviation between the short-term price and the average has also widened significantly. In the MACD indicator, the DIFF is 1.66, the DEA is -0.83, and the histogram has expanded to 4.99. The fast line has crossed above the slow line and continues to rise, indicating that the upward momentum has not yet shown a clear weakening. However, the DEA is still below the zero axis, suggesting that this round of market movement is more likely a rapid recovery from a deep weakness rather than a confirmation of a long-term trend. The closer the price is to the outer edge of the upper Bollinger Band, the more sensitive it is to new news. The most crucial factor at present is not the $93 price level itself, but the extent to which the rise translates from risk expectations into actual supply losses. If tankers only temporarily suspend operations and gradually resume passage, some of the shipping premium in the price may fall back; if shipments from Yanbu continue, but the passage rate in the Bab el-Mandeb Strait declines significantly, the market will further focus on increased floating storage, delivery delays, and tight near-month contracts.Fundamental verification will shift from export volume to arrival volume.
The future market cannot solely rely on whether Yanbu terminal continues loading. Loading volume represents nominal exports, while arrivals represent actual supply. If ships spend more time in the Red Sea, even with high export statistics, refineries may still face schedule mismatches. Secondly, it's crucial to monitor whether tanker diversion evolves from isolated incidents into industry-wide arrangements. A few ships turning back primarily affects sentiment, but multiple shipowners consistently avoiding the Bab el-Mandeb Strait will alter the global tanker capacity distribution. The third variable is whether large energy vessels can resume stable passage through the Strait of Hormuz. A current situation with only three commodity ships per day and a lack of very large crude carriers (VLCCs) cannot support normal-scale Gulf energy exports. The explanatory power of inventory data on prices may also temporarily decrease. Increased inventory in a particular consumption region does not indicate the disappearance of maritime transport risks; rather, it may be due to refineries replenishing their stocks in advance. The core of the current market trend is the rising time value of the supply chain; the market is repricing for longer voyages, lower vessel turnover rates, and greater delivery uncertainty.- Risk Warning and Disclaimer
- The market involves risk, and trading may not be suitable for all investors. This article is for reference only and does not constitute personal investment advice, nor does it take into account certain users’ specific investment objectives, financial situation, or other needs. Any investment decisions made based on this information are at your own risk.