Gold prices: The bottom has been confirmed, but where is the ceiling?
2026-07-22 18:42:15
Strong support at $4,000 helped gold successfully withstand negative fundamental factors. Rising US Treasury yields and a strong dollar would typically pose significant resistance, but gold prices have shown remarkable resilience in this round.  The US dollar strengthened for the fourth consecutive day amid airstrikes against Iran. Unconfirmed rumors of a temporary ceasefire pushed Brent crude prices near $93 a barrel and exacerbated market concerns about inflation. The market currently projects a roughly 50/50 probability of two Fed rate hikes in 2026, further supporting the dollar's performance. Demand Recovery: Capital Inflows Become Key Support This macroeconomic environment should have severely suppressed gold prices, but the rise in gold prices is particularly noteworthy. Historically, a strong dollar and high yields have often been typical headwinds for gold; however, this time, strong physical and financial demand has provided a solid backing for gold prices. ETF flows have shifted from continuous outflows to net inflows, with professional exchange-traded funds increasing holdings by 7.4 tons on July 21, the largest single-day increase this month. Furthermore, hedge funds have also increased their net long positions in gold to a five-week high, indicating that institutional investors are actively positioning themselves. The solidity of the key psychological and technical support level of $4,000/ounce, coupled with the relatively weak performance of gold in the previous period, led investors to generally believe that gold was oversold. By the end of June, gold recorded its worst monthly performance since the 2008 global financial crisis, and the fastest decline since 2013. Geopolitics and Supply Rumors During this period, the pressure on gold prices stemmed in part from rumors of central banks in Middle Eastern oil-producing countries selling gold through intermediaries, with Turkey being a focus of market attention. Turkey's gold reserves decreased by 81 tons in the first half of the year, equivalent to approximately $10.6 billion at current prices. The agreement reached between the US and Iran in June was theoretically intended to alleviate this sell-off, but escalating geopolitical tensions may instead accelerate the gold liquidation behavior of relevant countries. Risk Factors: Inflation and Federal Reserve Policy
 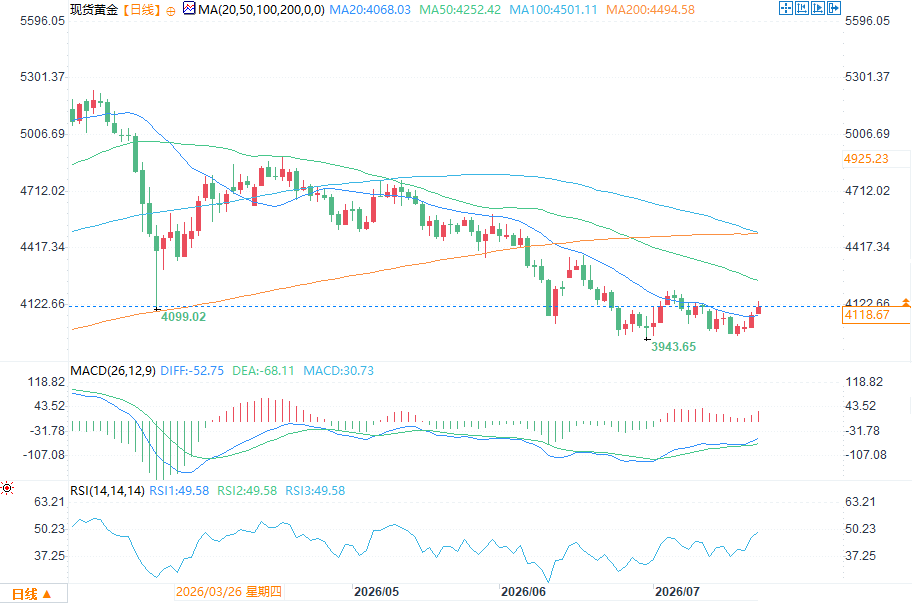 (Spot Gold Daily Chart Source: FX678) Despite the rebound in gold prices, the external macroeconomic backdrop remains challenging. The higher Brent crude oil prices, the greater the risk of the US economy falling into a prolonged period of high inflation. Meanwhile, the Federal Reserve's shift from its previous "dovish verbosity" to a more concise and hawkish stance has unsettled investors. In this environment, the market is increasingly worried that the Fed might suddenly tighten monetary policy without warning. Future Outlook: The Ceiling Depends on Multiple Variables Overall, gold's current performance highlights its unique appeal as a safe-haven asset and an inflation hedge. Despite unfavorable traditional fundamental indicators, geopolitical uncertainty, central bank gold purchases, and investor concerns about long-term inflation have collectively provided support. The future ceiling for gold prices will depend on the interplay of multiple factors, including the Fed's policy path, the evolution of the Middle East situation, and the global economic growth trend. In the short term, $4,000 remains a solid bottom, but breaking through previous highs and challenging new highs still requires more catalysts. Investors should closely monitor crude oil prices, the US dollar index, and the latest statements from Fed officials, as these variables will collectively determine the next stage of gold's price movement.
The US dollar strengthened for the fourth consecutive day amid airstrikes against Iran. Unconfirmed rumors of a temporary ceasefire pushed Brent crude prices near $93 a barrel and exacerbated market concerns about inflation. The market currently projects a roughly 50/50 probability of two Fed rate hikes in 2026, further supporting the dollar's performance. Demand Recovery: Capital Inflows Become Key Support This macroeconomic environment should have severely suppressed gold prices, but the rise in gold prices is particularly noteworthy. Historically, a strong dollar and high yields have often been typical headwinds for gold; however, this time, strong physical and financial demand has provided a solid backing for gold prices. ETF flows have shifted from continuous outflows to net inflows, with professional exchange-traded funds increasing holdings by 7.4 tons on July 21, the largest single-day increase this month. Furthermore, hedge funds have also increased their net long positions in gold to a five-week high, indicating that institutional investors are actively positioning themselves. The solidity of the key psychological and technical support level of $4,000/ounce, coupled with the relatively weak performance of gold in the previous period, led investors to generally believe that gold was oversold. By the end of June, gold recorded its worst monthly performance since the 2008 global financial crisis, and the fastest decline since 2013. Geopolitics and Supply Rumors During this period, the pressure on gold prices stemmed in part from rumors of central banks in Middle Eastern oil-producing countries selling gold through intermediaries, with Turkey being a focus of market attention. Turkey's gold reserves decreased by 81 tons in the first half of the year, equivalent to approximately $10.6 billion at current prices. The agreement reached between the US and Iran in June was theoretically intended to alleviate this sell-off, but escalating geopolitical tensions may instead accelerate the gold liquidation behavior of relevant countries. Risk Factors: Inflation and Federal Reserve Policy (Spot Gold Daily Chart Source: FX678) Despite the rebound in gold prices, the external macroeconomic backdrop remains challenging. The higher Brent crude oil prices, the greater the risk of the US economy falling into a prolonged period of high inflation. Meanwhile, the Federal Reserve's shift from its previous "dovish verbosity" to a more concise and hawkish stance has unsettled investors. In this environment, the market is increasingly worried that the Fed might suddenly tighten monetary policy without warning. Future Outlook: The Ceiling Depends on Multiple Variables Overall, gold's current performance highlights its unique appeal as a safe-haven asset and an inflation hedge. Despite unfavorable traditional fundamental indicators, geopolitical uncertainty, central bank gold purchases, and investor concerns about long-term inflation have collectively provided support. The future ceiling for gold prices will depend on the interplay of multiple factors, including the Fed's policy path, the evolution of the Middle East situation, and the global economic growth trend. In the short term, $4,000 remains a solid bottom, but breaking through previous highs and challenging new highs still requires more catalysts. Investors should closely monitor crude oil prices, the US dollar index, and the latest statements from Fed officials, as these variables will collectively determine the next stage of gold's price movement.
- Risk Warning and Disclaimer
- The market involves risk, and trading may not be suitable for all investors. This article is for reference only and does not constitute personal investment advice, nor does it take into account certain users’ specific investment objectives, financial situation, or other needs. Any investment decisions made based on this information are at your own risk.