Layoffs have fallen to a two-year low, so why hasn't the dollar index received a one-sided pricing logic?
2026-08-06 17:58:53
On Thursday, August 6th, the US labor market presented an atypical combination: companies announced a significant decrease in layoff plans, but the pace of hiring expansion was also sluggish. Latest data shows that employers announced 33,429 layoffs in July, a decrease of approximately 27% from 45,849 in June, and a 46% decrease from the 62,075 announced in July 2025, marking the lowest monthly level in two years. 
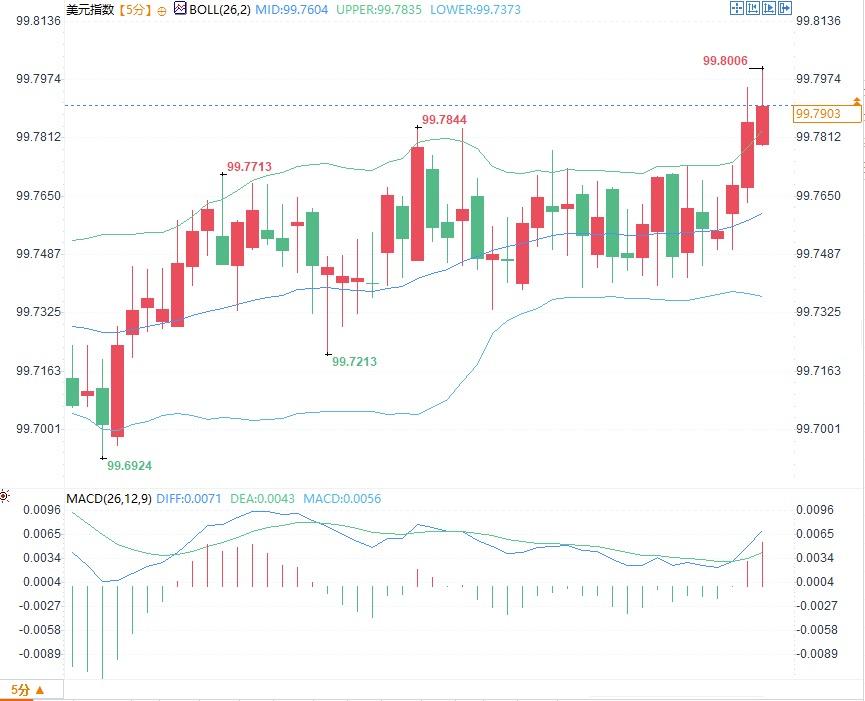 From a chart perspective, the US dollar index briefly broke through the upper Bollinger Band, and the MACD momentum strengthened, indicating an increased imbalance between buying and selling after the data release. However, volatility typically amplifies after prices deviate from the middle band. The more meaningful variables to observe now are whether subsequent non-farm payrolls, average hourly earnings, the unemployment rate, and the service sector employment component can form a consistent signal. At 17:54 Beijing time, the US dollar index was at 99.78.
A decrease in the total number of layoffs does not necessarily indicate a full recovery in employment demand.
The drop in layoffs to a two-year low primarily indicates that companies are reducing one-off large-scale cost-cutting plans. Compared to the same period in 2025, the cumulative layoffs in the first seven months of this year have decreased significantly, meaning that the high base effect from previous concentrated adjustments in some industries is fading. However, layoffs are statistics on positions that companies have decided to reduce, and do not directly reflect new positions, job vacancies, working hours, or labor participation rates. Therefore, they cannot be simply equated with a renewed acceleration in the job market. What traders should pay more attention to is the simultaneous occurrence of low layoffs and low hiring. Private sector employment increased by approximately 44,000 in July, the lowest increase in six months; the services activity index rose to 54.1, indicating that business activity is still in expansion territory, but the services employment sub-index fell to 47.4, entering contraction territory. The simultaneous increase in orders and decrease in employment suggests that some companies are coping with cost pressures by improving efficiency, adjusting job structures, and reducing new hiring. US non-farm payrolls increased by 57,000 in June, with the unemployment rate at 4.2%. July's non-farm payroll data has not yet been released, so layoff data can only serve as a leading indicator and cannot replace non-farm payrolls, the unemployment rate, and average hourly wages. Market assessments of the employment situation require distinguishing between whether existing jobs are stable and whether new labor demand is expanding.Artificial intelligence has become a key variable in layoffs, and industry differentiation continues to deepen.
In July, the tech industry announced 9,867 layoffs, bringing the year-to-date total to 149,023, a 67% increase year-over-year. Artificial intelligence (AI)-related factors accounted for 10,970 layoff plans, making it the leading reason for company layoffs for the fifth consecutive month; this represents a cumulative total of 112,713 layoffs this year, approximately 24% of all layoffs. This indicates that this round of adjustments is not a traditional demand-driven layoff, but rather a job restructuring driven by changes in capital expenditure focus, business processes, and organizational structure. After increasing investment in AI, companies typically first reduce repetitive positions, back-office processes, and some basic technical functions, while increasing demand for data infrastructure, computing power management, security governance, and advanced R&D. Therefore, increased layoffs in the tech industry are not contradictory to the expansion of tech investment. The former reflects the replacement or consolidation of old positions, while the latter reflects the reallocation of capital towards new technology systems. Total employment may remain relatively stable, but job skill structures, wage distribution, and labor productivity will change significantly. From a macro perspective, this adjustment may have two types of impacts simultaneously. On the one hand, job streamlining reduces labor costs for businesses, improving profit margins and productivity; on the other hand, if newly created jobs cannot absorb the replaced workforce in a timely manner, residents' income expectations and consumption propensity may be constrained. What the dollar market really needs to assess is not just the number of layoffs, but whether productivity improvements can outpace the cooling of wages and demand.The pricing of the US dollar still depends on a combination of inflation, employment, and interest rate expectations.
The Federal Reserve maintained the target range for the federal funds rate at 3.50% to 3.75% at its July meeting. The core policy dilemma remains the balance between sticky inflation and slowing labor demand. While reduced layoffs lower the probability of a sudden deterioration in employment, the contraction in service sector employment and the slowdown in private sector hiring are insufficient to support a judgment of a significant warming labor market. Therefore, the impact of layoff data on the dollar index is more of a risk correction than a trend signal. The data weakened recession fears triggered by concentrated corporate layoffs, but did not change the fact that new job growth was weak. Short-term dollar fluctuations will still be influenced by interest rate expectations, energy prices, interest rate differentials between major currencies, and safe-haven demand. From a chart perspective, the US dollar index briefly broke through the upper Bollinger Band, and the MACD momentum strengthened, indicating an increased imbalance between buying and selling after the data release. However, volatility typically amplifies after prices deviate from the middle band. The more meaningful variables to observe now are whether subsequent non-farm payrolls, average hourly earnings, the unemployment rate, and the service sector employment component can form a consistent signal. At 17:54 Beijing time, the US dollar index was at 99.78.
- Risk Warning and Disclaimer
- The market involves risk, and trading may not be suitable for all investors. This article is for reference only and does not constitute personal investment advice, nor does it take into account certain users’ specific investment objectives, financial situation, or other needs. Any investment decisions made based on this information are at your own risk.